[ad_1]
Users interact with services in real-time. They login to websites, like and share posts, purchase goods and even converse, all in real-time. So why is it that whenever you have a problem when using a service and you reach a customer support representative, that they never seem to know who you are or what you’ve been doing recently?
This is likely because they haven’t built a customer 360 profile and if they have, it certainly isn’t real-time. Here, real-time means within the last couple of minutes if not seconds. Understanding everything the customer has just done prior to contacting customer support gives the team the best chance to understand and solve the customer’s problem.
This is why a real-time Customer 360 profile is more useful than a batch, data warehouse generated profile, as I want to keep the latency low, which isn’t feasible with a traditional data warehouse. In this post, I’ll walk through what a customer 360 profile is and how to build one that updates in real-time.
What Is a Customer 360 Profile?
The purpose of a customer 360 profile is to provide a holistic view of a customer. The goal is to take data from all the disparate services that the customer interacts with, concerning a product or service. This data is brought together, aggregated and then often displayed via a dashboard for use by the customer support team.
When a customer calls the support team or uses online chat, the team can quickly understand who the customer is and what they’ve done recently. This removes the need for the tedious, script-read questions, meaning the team can get straight to solving the problem.
With this data all in one place, it can then be used downstream for predictive analytics and real-time segmentation. This can be used to provide more timely and relevant marketing and front-end personalisation, enhancing the customer experience.
Use Case: Fashion Retail Store
To help demonstrate the power of a customer 360, I’ll be using a national Fashion Retail Brand as an example. This brand has multiple stores across the country and a website allowing customers to order items for delivery or store pick up.
The brand has a customer support centre that deals with customer enquiries about orders, deliveries, returns and fraud. What they would like is a customer 360 dashboard so that when a customer contacts them with an issue, they can see the latest customer details and activity in real-time.
The data sources available include:
- users (MongoDB): Core customer data such as name, age, gender, address.
- online_orders (MongoDB): Online purchase data including product details and delivery addresses.
- instore_orders (MongoDB): In-store purchase data again including product details and store location.
- marketing_emails (Kafka): Marketing data including items sent and any interactions.
- weblogs (Kafka): Website analytics such as logins, browsing, purchases and any errors.
In the rest of the post, using these data sources, I’ll show you how to consolidate all of this data into one place in real-time and surface it to a dashboard.
Platform Architecture
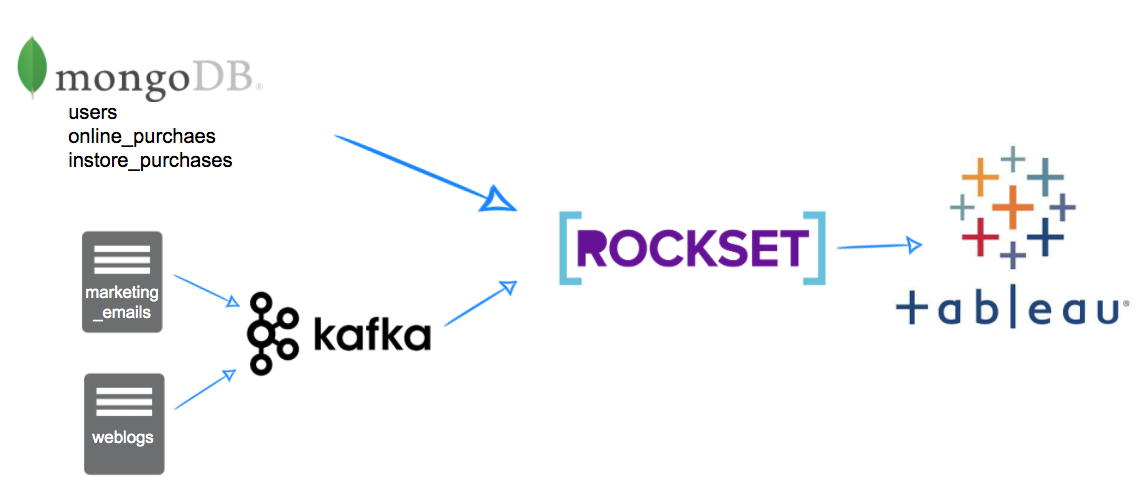
The first step in building a customer 360 is consolidating the different data sources into one place. Due to the real-time requirements of our fashion brand, we need a way to keep the data sources in sync in real-time and also allow rapid retrieval and analytics on this data so it can be presented back in a dashboard.
For this, we’ll use Rockset. The customer and purchase data is currently stored in a MongoDB database which can simply be replicated into Rockset using a built-in connector. To get the weblogs and marketing data I’ll use Kafka, as Rockset can then consume these messages as they’re generated.
What we’re left with is a platform architecture as shown in Fig 1. With data flowing through to Rockset in real-time, we can then display the customer 360 dashboards using Tableau. This approach allows us to see customer interactions in the last few minutes or even seconds on our dashboard. A traditional data warehouse approach would significantly increase this latency due to batch data pipelines ingesting the data. Rockset can maintain data latency in the 1-2 second range when connecting to an OLTP database or to data streams.

Fig 1. Platform architecture diagram
I’ve written posts on integrating Kafka topics into Rockset and also utilising the MongoDB connector that go into more detail on how to set these integrations up. In this post, I’m going to concentrate more on the analytical queries and dashboard building and assume this data is already being synced into Rockset.
Building the Dashboard with Tableau
The first thing we need to do is get Tableau talking to Rockset using the Rockset documentation. This is fairly straightforward and only requires downloading a JDBC connector and putting it in the correct folder, then generating an API key within your Rockset console that will be used to connect in Tableau.
Once done, we can now work on building our SQL statements to provide us with all the data we need for our Dashboard. I recommend building this in the Rockset console and moving it over to Tableau later on. This will give us greater control over the statements that are submitted to Rockset for better performance.
First, let’s break down what we want our dashboard to show:
- Basic customer details including first name, last name
- Purchase stats including number of online and in-store purchases, most popular items bought and amount spent all time
- Recent activity stats including last purchase dates last login, last website visit and last email interaction
- Details about most recent errors whilst browsing online
Now we can work on the SQL for bringing all of these properties together.
1. Basic Customer Details
This one is easy, just a simple SELECT from the users collection (replicated from MongoDB).
SELECT users.id as customer_id,
       users.first_name,
       users.last_name,
       users.gender,
       DATE_DIFF('year',CAST(dob as date), CURRENT_DATE()) as age
FROM fashion.users
2. Purchase Statistics
First, we want to get all of the online_purchases statistics. Again, this data has been replicated by Rockset’s MongoDB integration. Simply counting the number of orders and number of items and also dividing one by the other to get an idea of items per order.
SELECT *
FROM (SELECT 'Online' AS "type",
             online.user_id AS customer_id,
             COUNT(DISTINCT ON line._id) AS number_of_online_orders,
             COUNT(*) AS number_of_items_purchased,
             COUNT(*) / COUNT(DISTINCT ON line._id) AS items_per_order
      FROM fashion.online_orders online,
           UNNEST(online."items")
      GROUP BY 1,
               2) online
UNION ALL
(SELECT 'Instore' AS "type",
       instore.user_id AS customer_id,
       COUNT(DISTINCT instore._id) AS number_of_instore_orders,
       COUNT(*) AS number_of_items_purchased,
       COUNT(*) / COUNT(DISTINCT instore._id) AS items_per_order
FROM fashion.instore_orders instore,
     UNNEST(instore."items")
GROUP BY 1,
         2)
We can then replicate this for the instore_orders and union the two statements together.
3. Most Popular Items
We now want to understand the most popular items purchased by each user. This one simply calculates a count of products by user. To do this we need to unnest the items, this gives us one row per order item ready for counting.
SELECT online_orders.user_id AS "Customer ID",
       UPPER(basket.product_name) AS "Product Name",
       COUNT(*) AS "Purchases"
FROM fashion.online_orders,
     UNNEST(online_orders."items") AS basket
GROUP BY 1,
         2
4. Recent Activity
For this, we will use all tables and get the last time the user did anything on the platform. This encompasses the users, instore_orders and online_orders data sources from MongoDB alongside the weblogs and marketing_emails data streamed in from Kafka. A slightly longer query as we’re getting the max date for each event type and unioning them together, but once in Rockset it’s trivial to combine these data sets.
SELECT event,
       user_id AS customer_id,
       "date"
FROM (SELECT 'Instore Order' AS event,
             user_id,
             CAST(MAX(DATE) AS datetime) "date"
      FROM fashion.instore_orders
      GROUP BY 1,
               2) x
UNION
(SELECT 'Online Order' AS event,
       user_id,
       CAST(MAX(DATE) AS datetime) last_online_purchase_date
FROM fashion.online_orders
GROUP BY 1,
         2)
UNION
(SELECT 'Email Sent' AS event,
       user_id,
       CAST(MAX(DATE) AS datetime) AS last_email_date
FROM fashion.marketing_emails
GROUP BY 1,
         2)
UNION
(SELECT 'Email Opened' AS event,
       user_id,
       CAST(MAX(CASE WHEN email_opened THEN DATE ELSE NULL END) AS datetime) AS last_email_opened_date
FROM fashion.marketing_emails
GROUP BY 1,
         2)
UNION
(SELECT 'Email Clicked' AS event,
       user_id,
       CAST(MAX(CASE WHEN email_clicked THEN DATE ELSE NULL END) AS datetime) AS last_email_clicked_date
FROM fashion.marketing_emails
GROUP BY 1,
         2)
UNION
(SELECT 'Website Visit' AS event,
       user_id,
       CAST(MAX(DATE) AS datetime) AS last_website_visit_date
FROM fashion.weblogs
GROUP BY 1,
         2)
UNION
(SELECT 'Website Login' AS event,
       user_id,
       CAST(MAX(CASE WHEN weblogs.page="login_success.html" THEN DATE ELSE NULL END) AS datetime) AS last_website_login_date
FROM fashion.weblogs
GROUP BY 1,
         2)
5. Recent Errors
Another simple query to get the page the user was on, the error message and the last time it occurred using the weblogs dataset from Kafka.
SELECT users.id AS "Customer ID",
       weblogs.error_message AS "Error Message",
       weblogs.page AS "Page Name",
       MAX(weblogs.date) AS "Date"
FROM fashion.users
  LEFT JOIN fashion.weblogs ON weblogs.user_id = users.id
WHERE weblogs.error_message IS NOT NULL
GROUP BY 1,
         2,
         3
Creating a Dashboard
Now we want to pull all of these SQL queries into a Tableau workbook. I find it best to create a data source and worksheet per section and then create a dashboard to tie them all together.
In Tableau, I built 6 worksheets, one for each of the SQL statements above. The worksheets each display the data simply and intuitively. The idea is that these 6 worksheets can then be combined into a dashboard that allows the customer service member to search for a customer and display a 360 view.
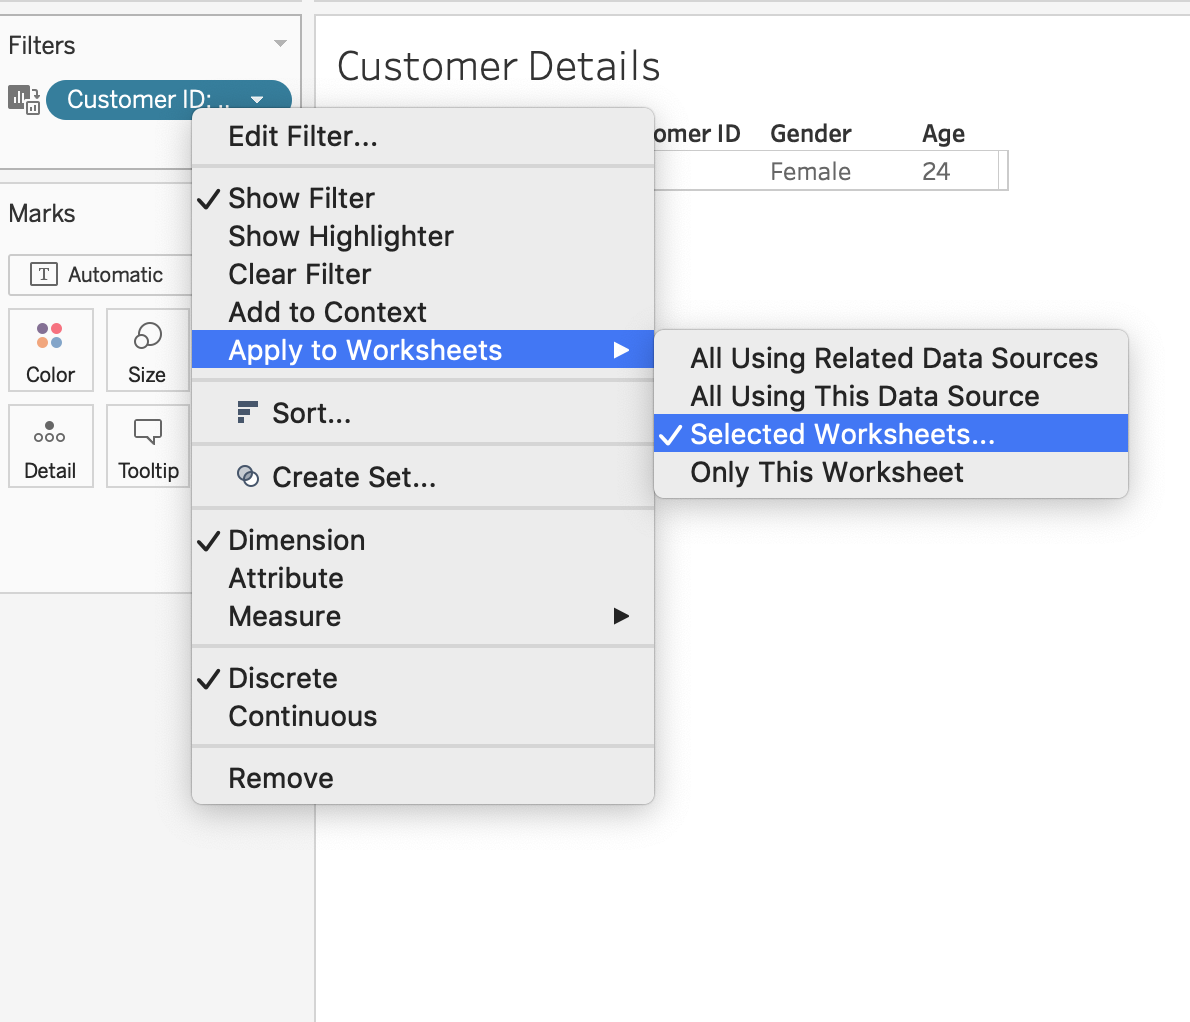
To do this in Tableau, we need the filtering column to have the same name across all the sheets; I called mine “Customer ID”. You can then right-click on the filter and apply to selected worksheets as shown in Fig 2.

Fig 2. Applying a filter to multiple worksheets in Tableau
This will bring up a list of all worksheets that Tableau can apply this same filter to. This will be helpful when building our dashboard as we only need to include one search filter that will then be applied to all the worksheets. You must name the field the same across all your worksheets for this to work.
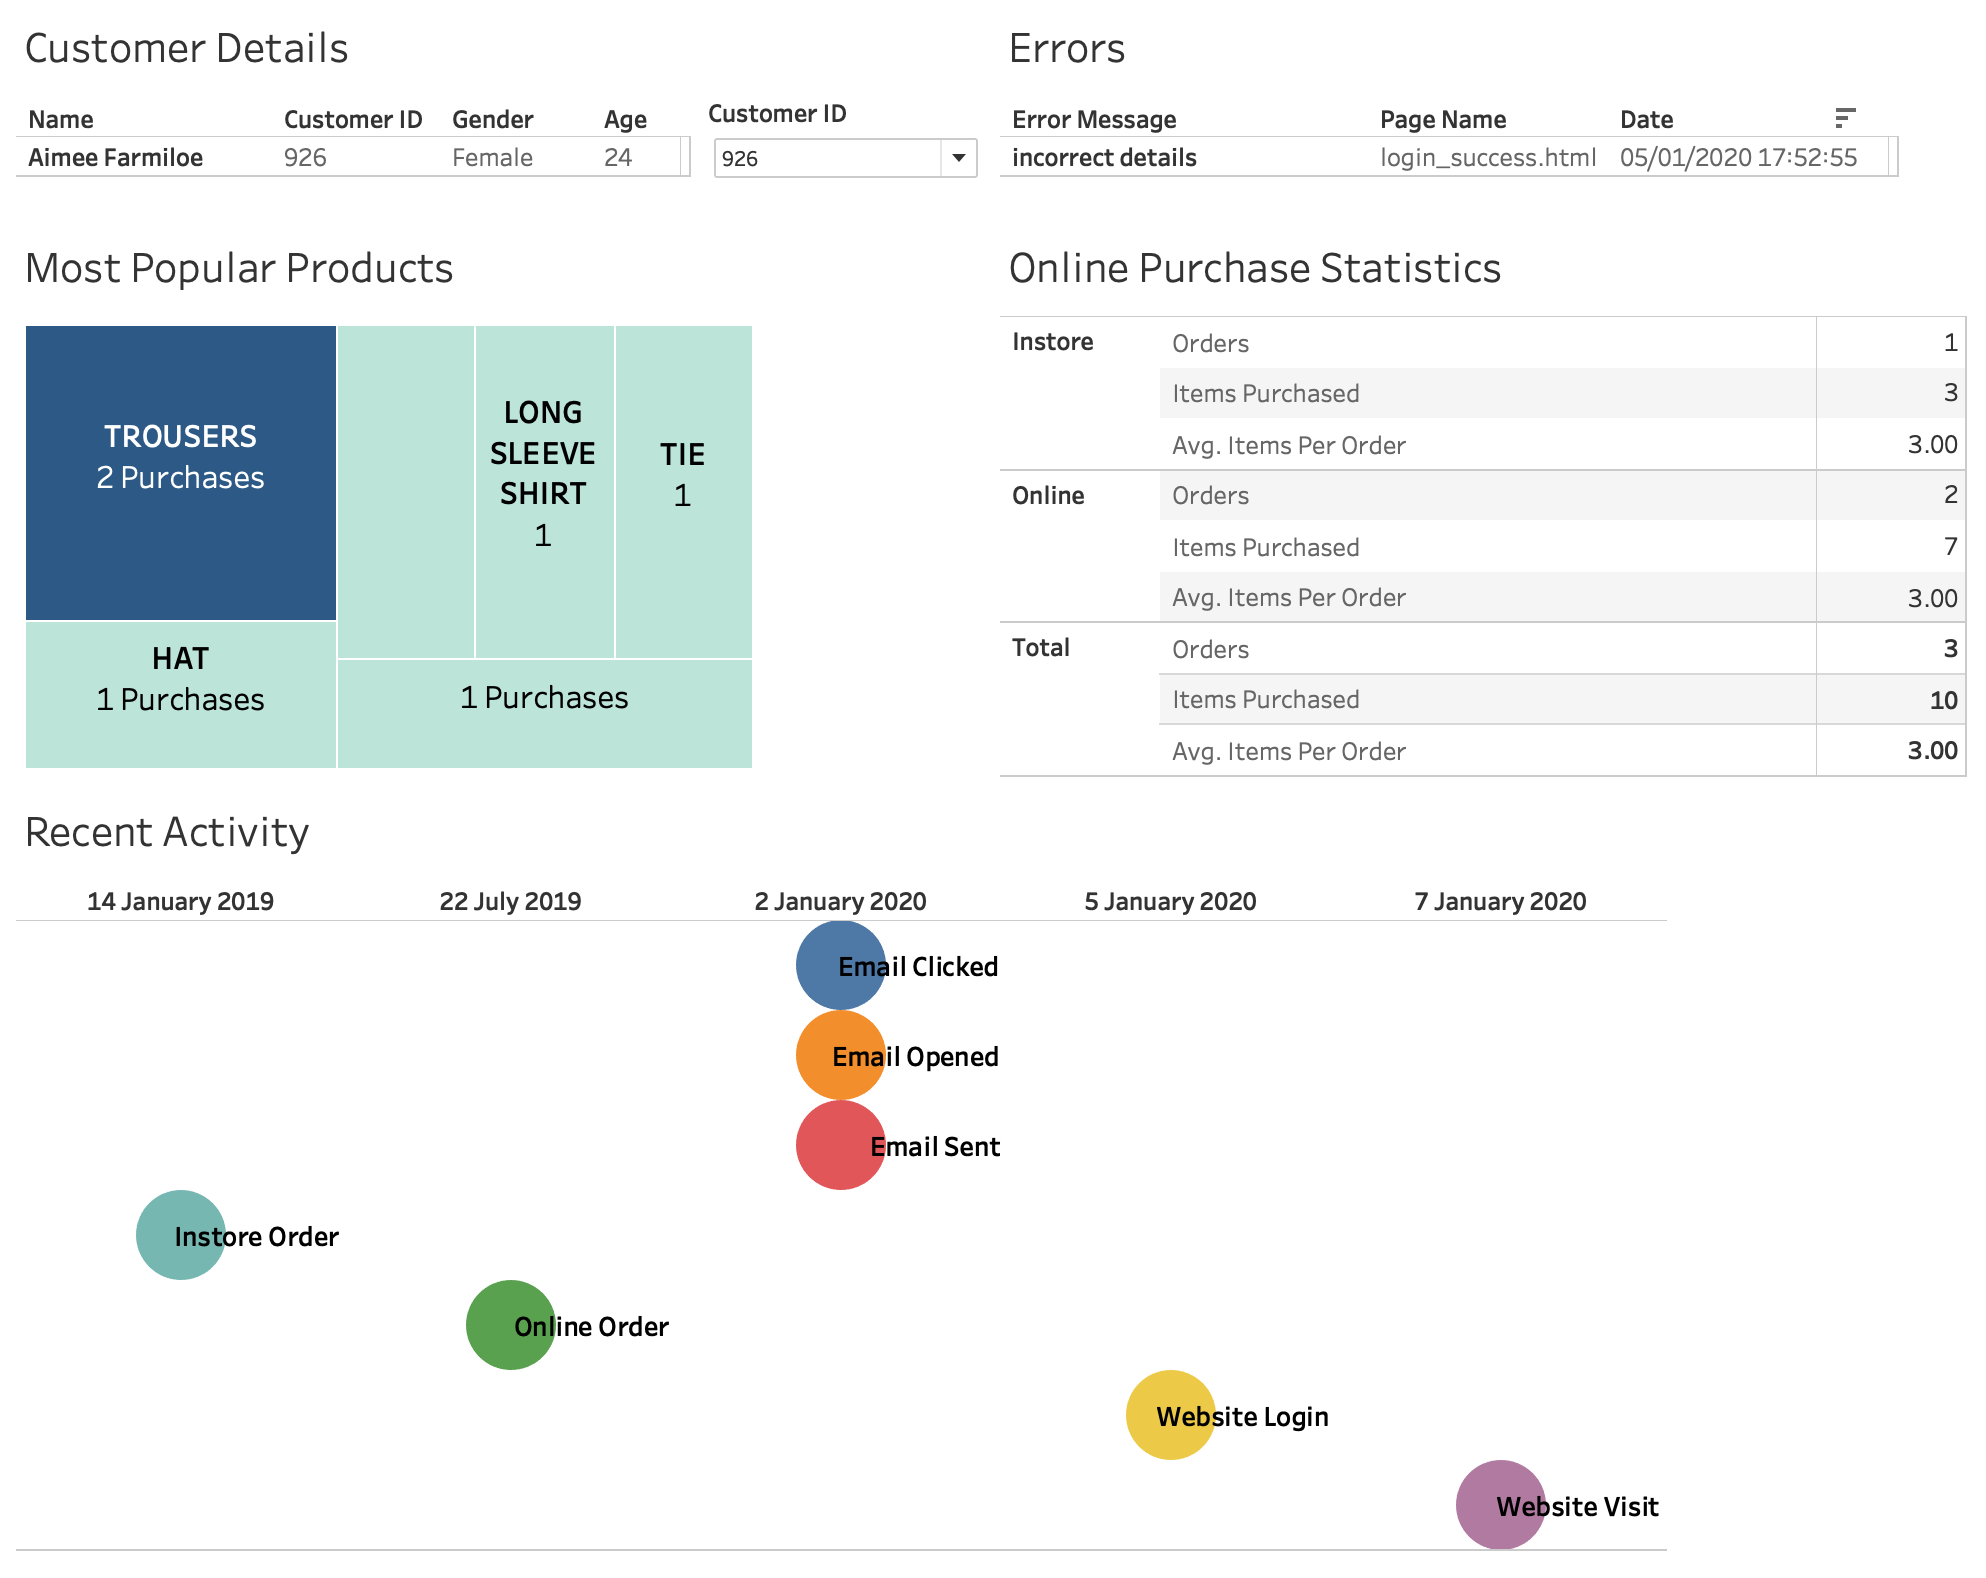
Fig 3 shows all of the worksheets put together in a simple dashboard. All of the data within this dashboard is backed by Rockset and therefore reaps all of its benefits. This is why it’s important to use the SQL statements directly in Tableau rather than creating internal Tableau data sources. In doing this, we ask Rockset to perform the complex analytics, meaning the data can be crunched efficiently. It also means that any new data that is synced into Rockset is made available in real-time.

Fig 3. Tableau customer 360 dashboard
If a customer contacts support with a query, their latest activity is immediately available in this dashboard, including their latest error message, purchase history and email activity. This allows the customer service member to understand the customer at a glance and get straight to resolving their query, instead of asking questions that they should already know the answer to.
The dashboard gives an overview of the customer’s details in the top left and any recent errors in the top right. In between is the filter/search capability to select a customer based on who is calling. The next section gives an at-a-glance view of the most popular products purchased by the customer and their lifetime purchase statistics. The final section shows an activity timeline showing the most recent interactions with the service across email, in-store and online channels.
Further Potential
Building a customer 360 profile doesn’t have to stop at dashboards. Now you have data flowing into a single analytics platform, this same data can be used to improve customer front end experience, provide cohesive messaging across web, mobile and marketing and for predictive modelling.
Rocket’s in-built API means this data can be made accessible to the front end. The website can then use these profiles to personalise the front end content. For example, a customer’s favourite products can be used to display those products front and centre on the website. This requires less effort from the customer, as it’s now likely that what they came to your website for is right there on the first page.
The marketing system can use this data to ensure that emails are personalised in the same way. That means the customer visits the website and sees recommended products that they also see in an email a few days later. This not only personalises their experience but ensures it’s cohesive across all channels.
Finally, this data can be extremely powerful when used for predictive analytics. Understanding behaviour for all users across all areas of a business means patterns can be found and used to understand likely future behaviour. This means you are no longer reacting to actions, like showing previously purchased items on the home page, and you can instead show expected future purchases.
Lewis Gavin has been a data engineer for five years and has also been blogging about skills within the Data community for four years on a personal blog and Medium. During his computer science degree, he worked for the Airbus Helicopter team in Munich enhancing simulator software for military helicopters. He then went on to work for Capgemini where he helped the UK government move into the world of Big Data. He is currently using this experience to help transform the data landscape at easyfundraising.org.uk, an online charity cashback site, where he is helping to shape their data warehousing and reporting capability from the ground up.
[ad_2]