In this blog, we examine DynamoDB reporting and analytics, which can be challenging given the lack of SQL and the difficulty running analytical queries in DynamoDB. We will demonstrate how you can build an interactive dashboard with Tableau, using SQL on data from DynamoDB, in a series of easy steps, with no ETL involved.
DynamoDB is a widely popular transactional primary data store. It is built to handle unstructured data models and massive scales. DynamoDB is often used for organization’s most critical business data, and as such there is value in being able to visualize and dig deeper into this data.
Tableau, also widely popular, is a tool for building live, interactive charts and dashboards. In this blog post, we will walk through an example of using Tableau to visualize data in DynamoDB.
DynamoDB works well out-of-the-box for simple lookups by the primary key. For lookups by a different attribute, DynamoDB allows creating a local or global secondary index. However, for even more complex access patterns like filtering on nested or multiple fields, sorting, and aggregations—types of queries that commonly power dashboards—DynamoDB alone is not sufficient. This blog post evaluates a few approaches to bridge this gap.
In this post, we will create an example business dashboard in Tableau on data in DynamoDB, using Rockset as the SQL intelligence layer in between, and JDBC to connect Tableau and Rockset.
The Data
For this example, I’ve combined sample data from Airbnb and mock data from Mockaroo to generate realistic records of users with listings, bookings, and reviews for a hypothetical home rental marketplace. (All names and emails are fake.) The mock data and scripts are available on Github.
The data model is typical for a DynamoDB use case—here’s an example item:
{
    "user_id": "28c38f9e-463d-4eae-b53d-16cdad48f150",
    "first_name": "Kimberlyn",
    "last_name": "Maudlin",
    "email": "kmaudlin24@bandcamp.com",
    "listings": [
        {
            "listing_id": "8472954",
            "title": "Private bedroom in adorable home",
            "description": "The spare bedroom in our adorable 2 bedroom home ... ",
            "city": "Bomomani",
            "country": "Indonesia",
            "listed_date": "2015-09-30",
            "cancellation_policy": "flexible",
            "price_usd": "51.00",
            "bathrooms": "2",
            "bedrooms": "2",
            "beds": "2",
            "bookings": [
                {
                    "user": {
                        "user_id": "530cd0c7-b79b-4f94-9e0f-969fc7f9855b",
                        "first_name": "Nahum",
                        "last_name": "Yaus",
                        "email": "nyaus9@angelfire.com"
                    },
                    "start_date": "2015-12-07",
                    "length_days": "5",
                    "review": {
                        "text": "Great convenient location, clean, and ... ",
                        "rating": "3"
                    },
                    "cost_usd": "230.84"
                }
            ]
        }
    ]
}
A few things to note:
- In our data, sometimes the
reviewfield will be missing (if the user did not leave a review). - The
bookingsandlistingsarrays may be empty, or arbitrarily long! - The
userfield is denormalized and duplicated within a booking, but also exists separately as its own item.
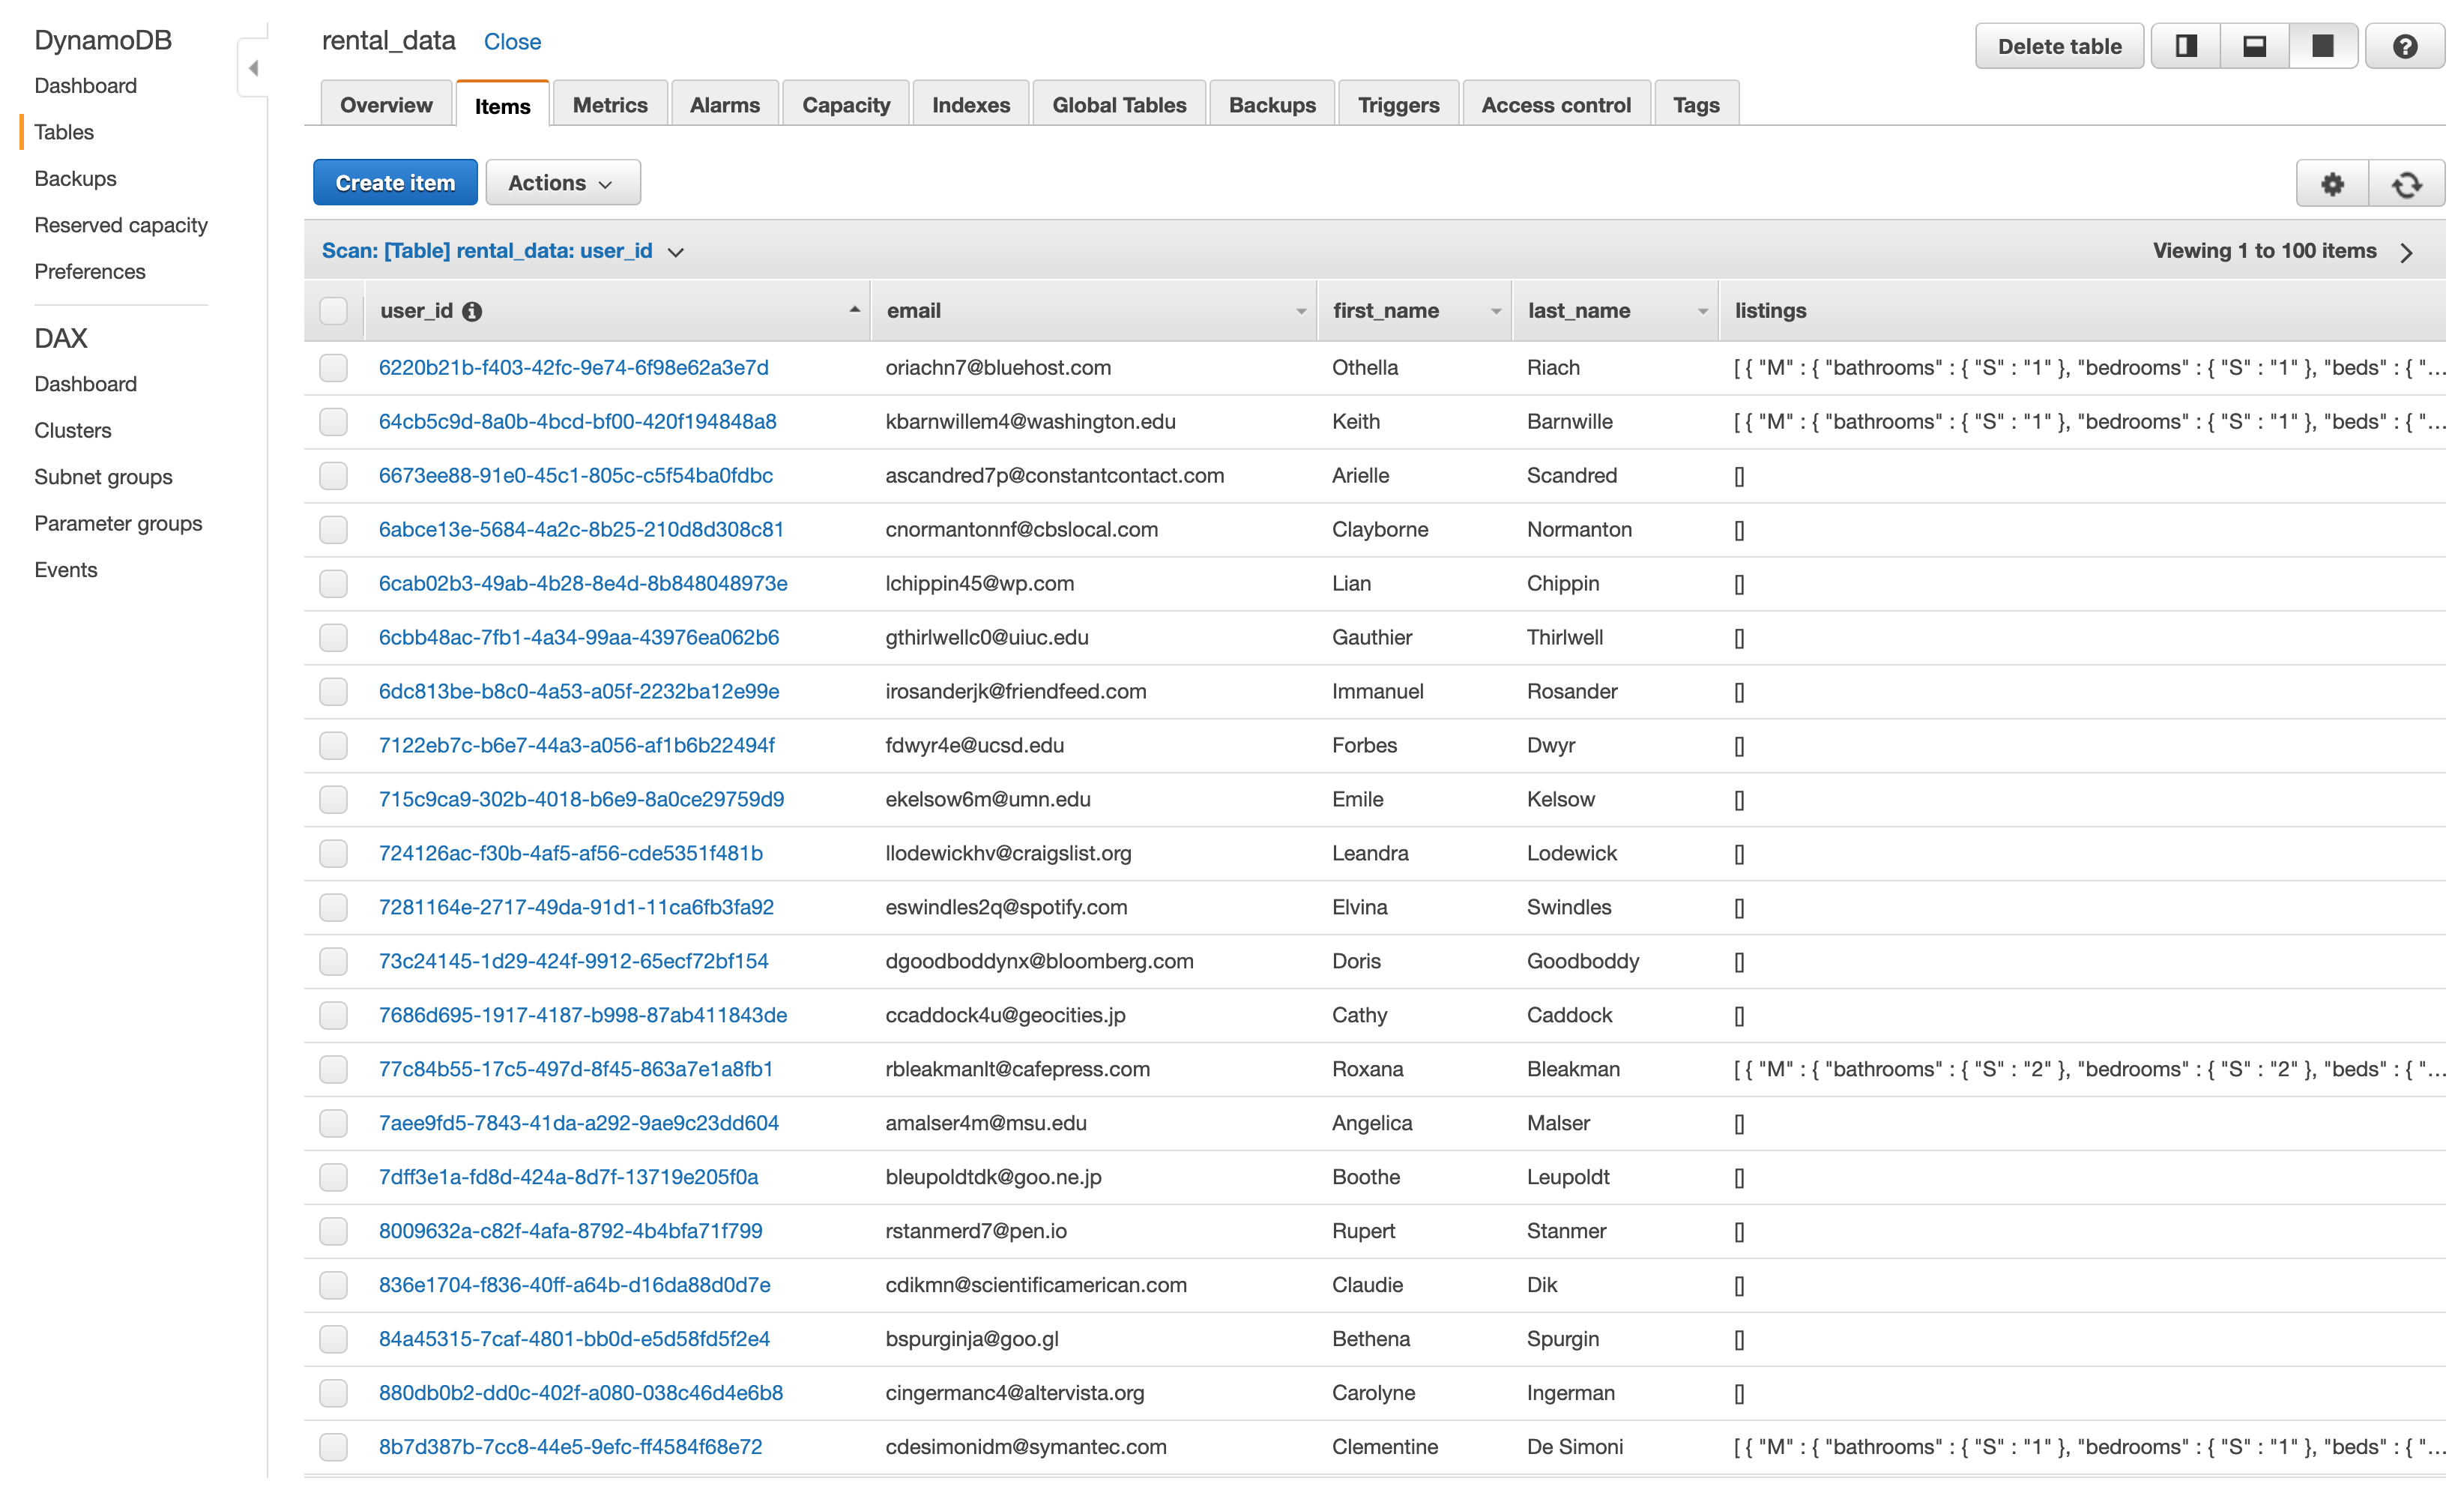
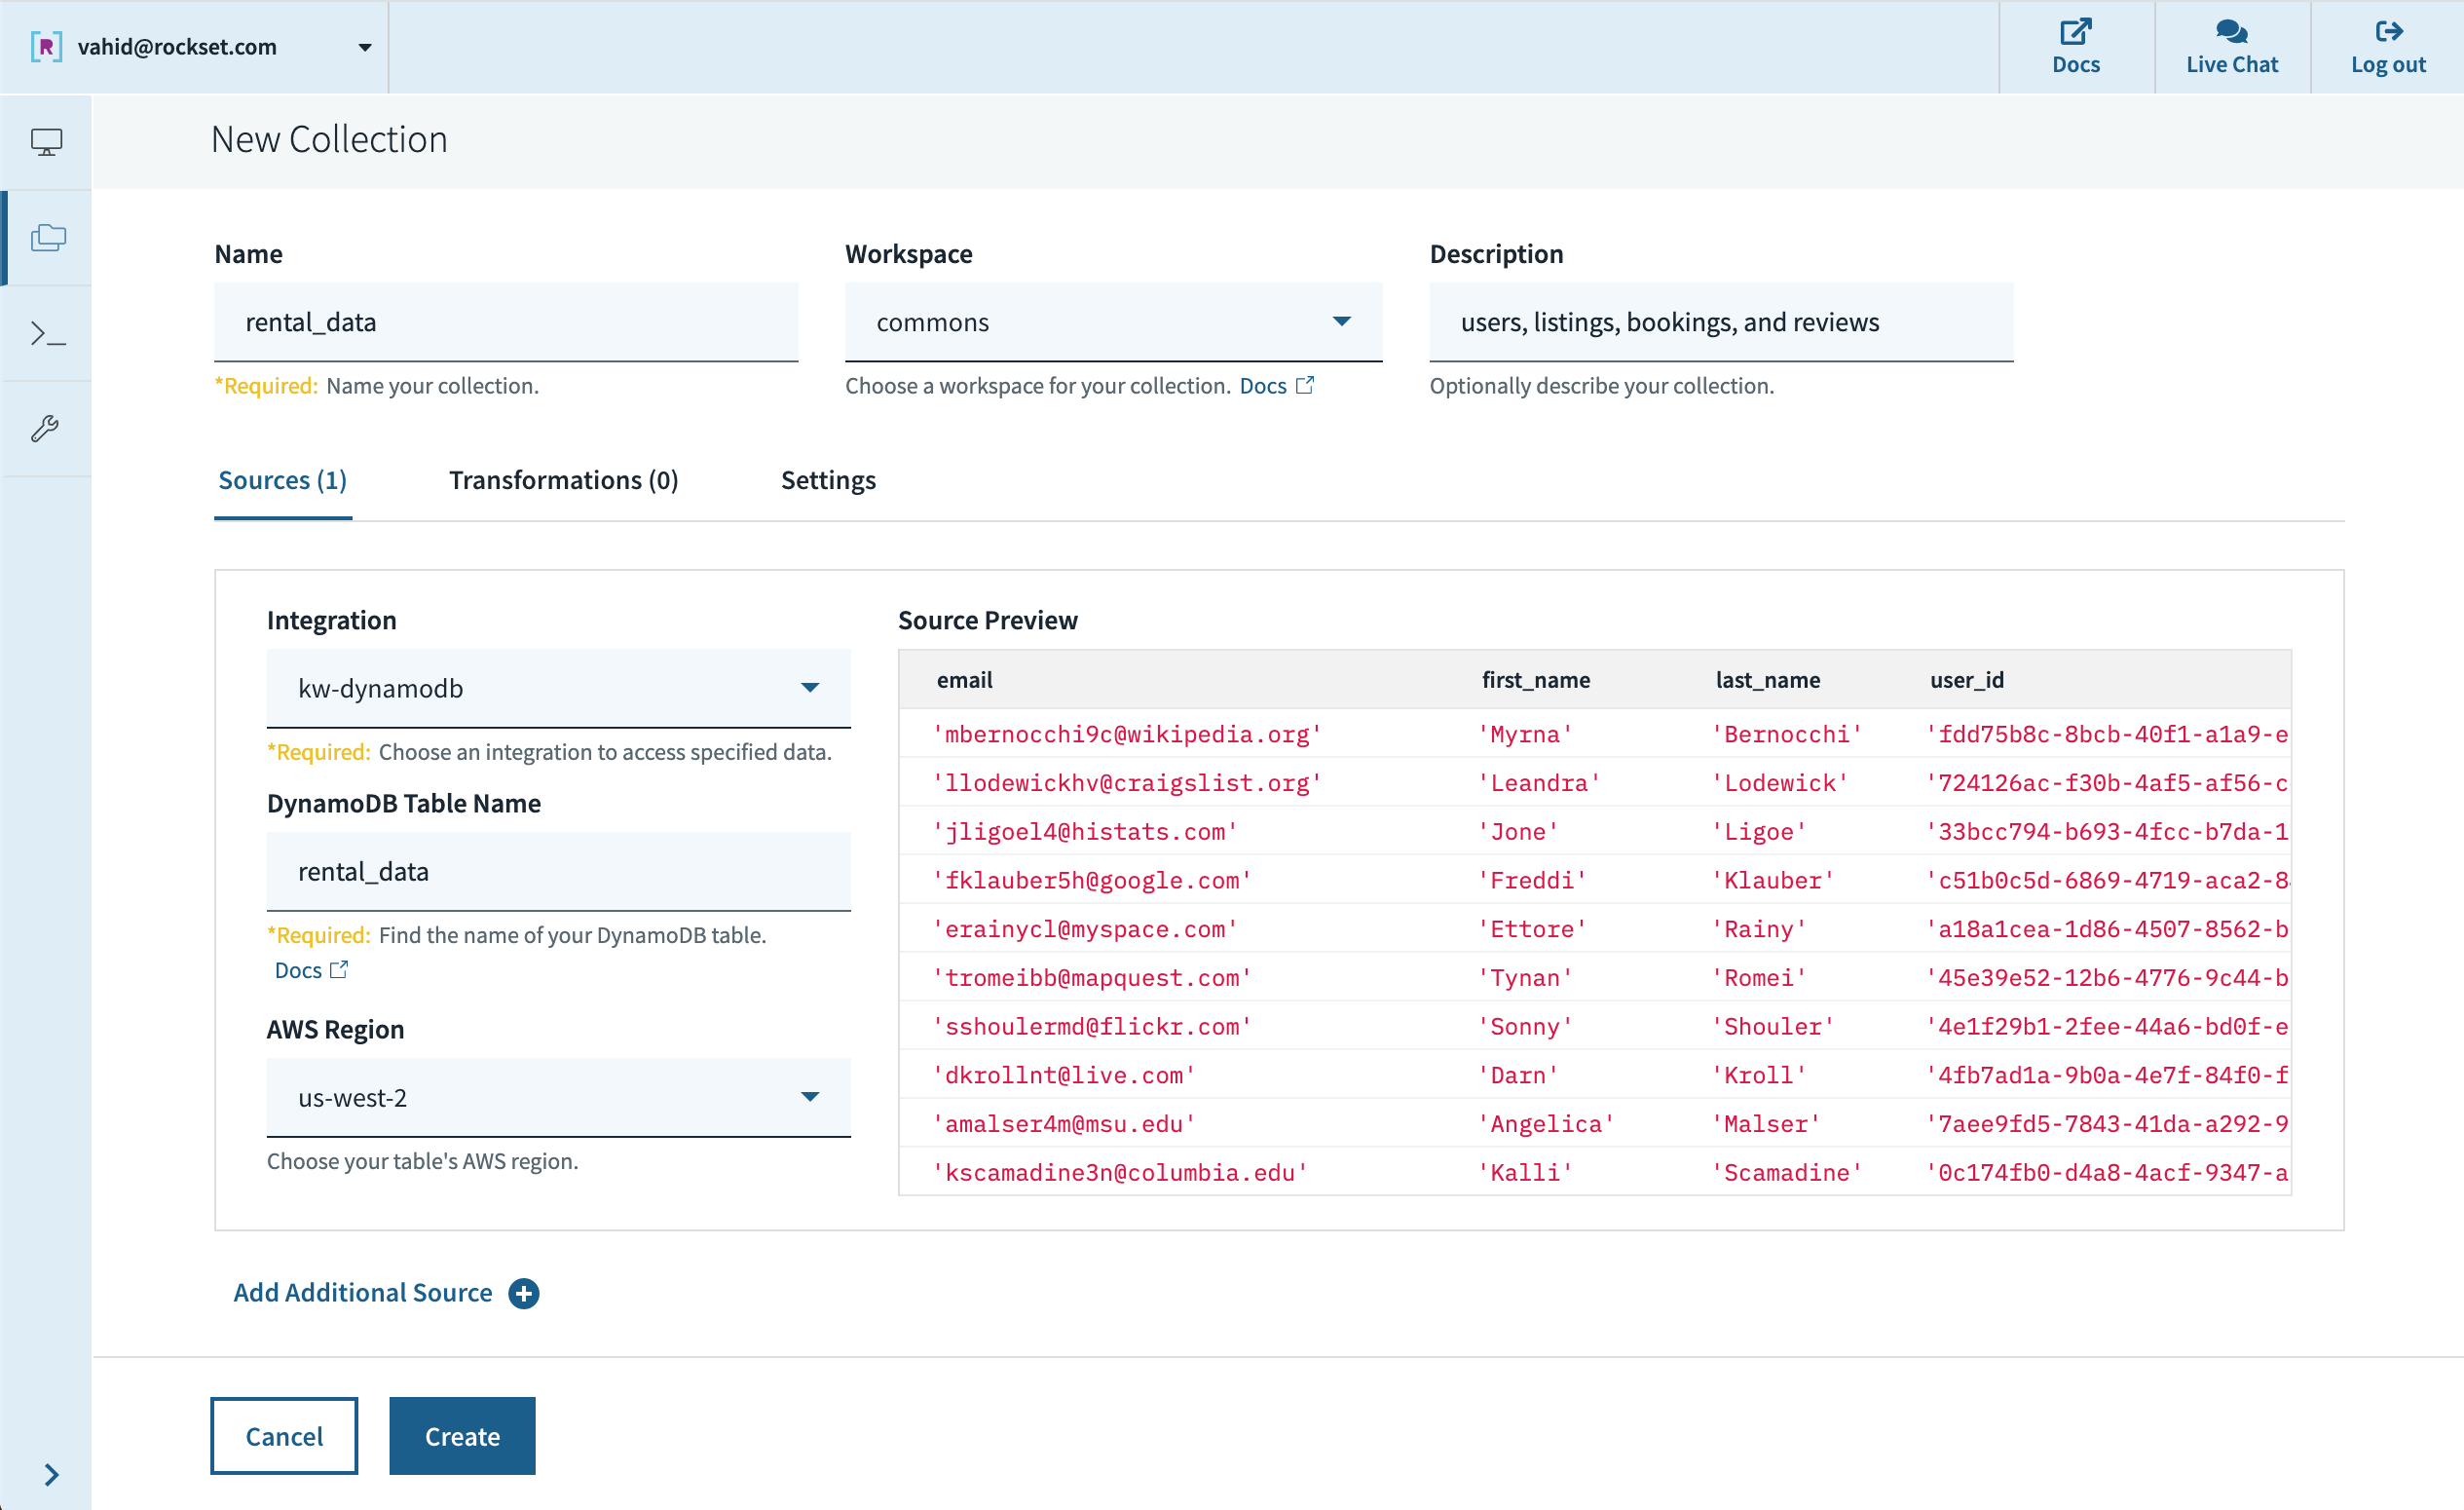
We start with a DynamoDB table called rental_data loaded with 21,964 such records:
Connecting Tableau to DynamoDB
Let’s see this data into Tableau!
We’ll need accounts for Tableau Desktop and Rockset. I also assume we’ve already set up credentials to access our DynamoDB table.
First, we need to download the Rockset JDBC driver from Maven and place it in ~/Library/Tableau/Drivers for Mac or C:\Program Files\Tableau\Drivers for Windows.
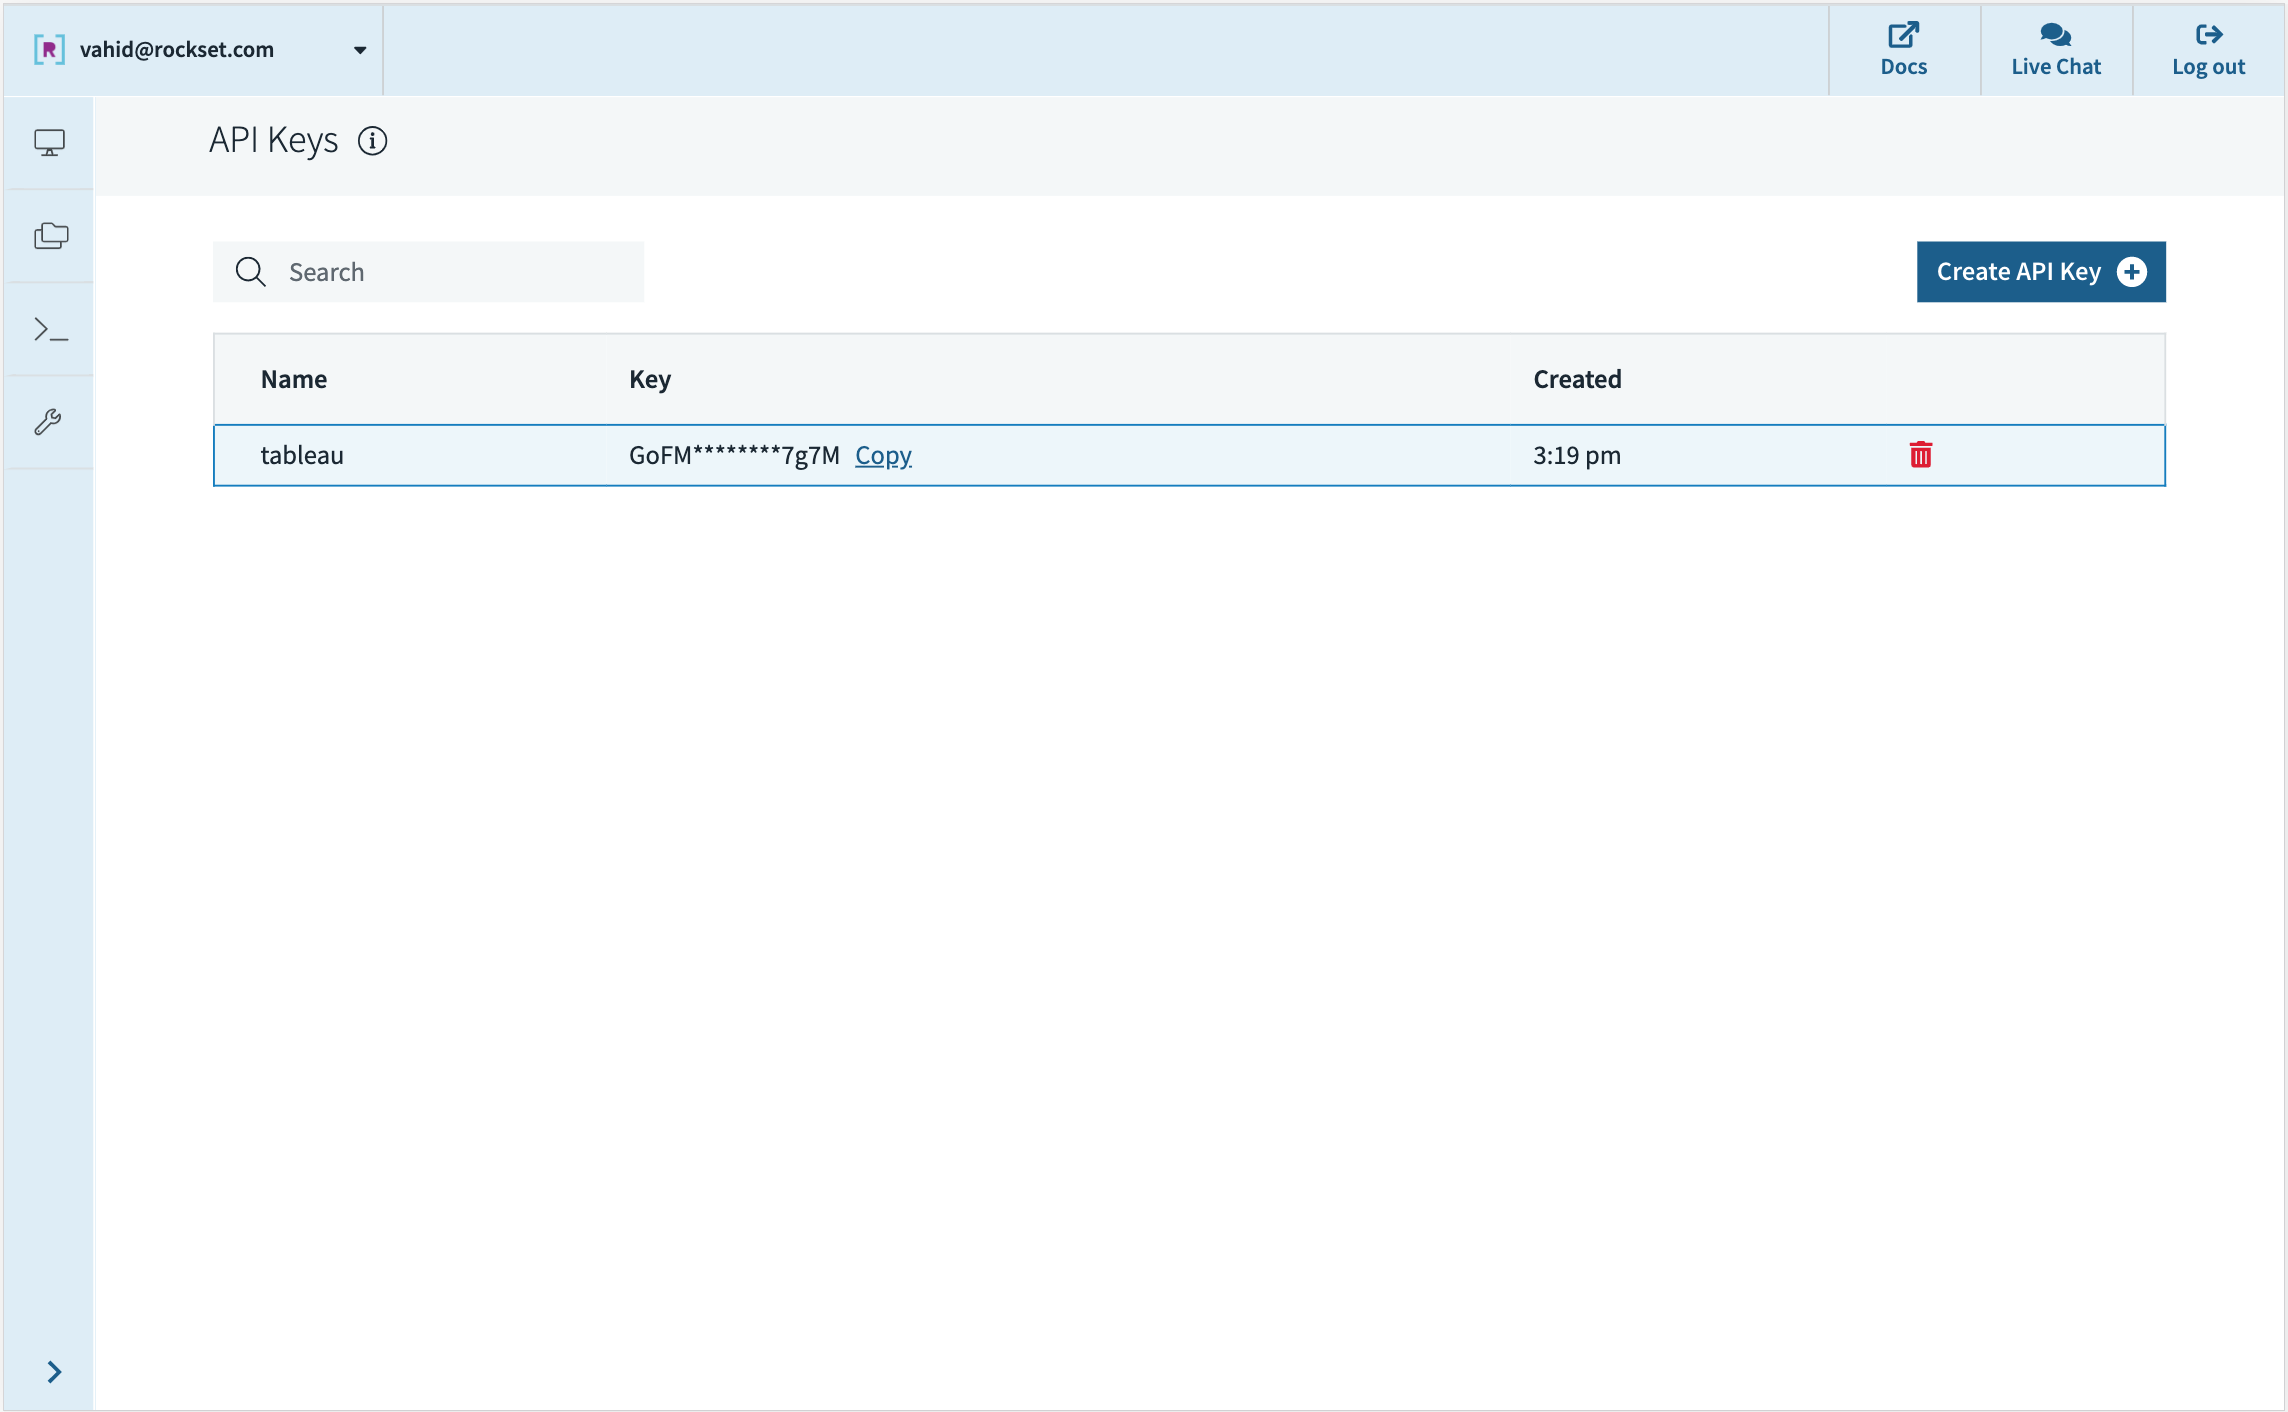
Next, let’s create an API key in Rockset that Tableau will use for authenticating requests:
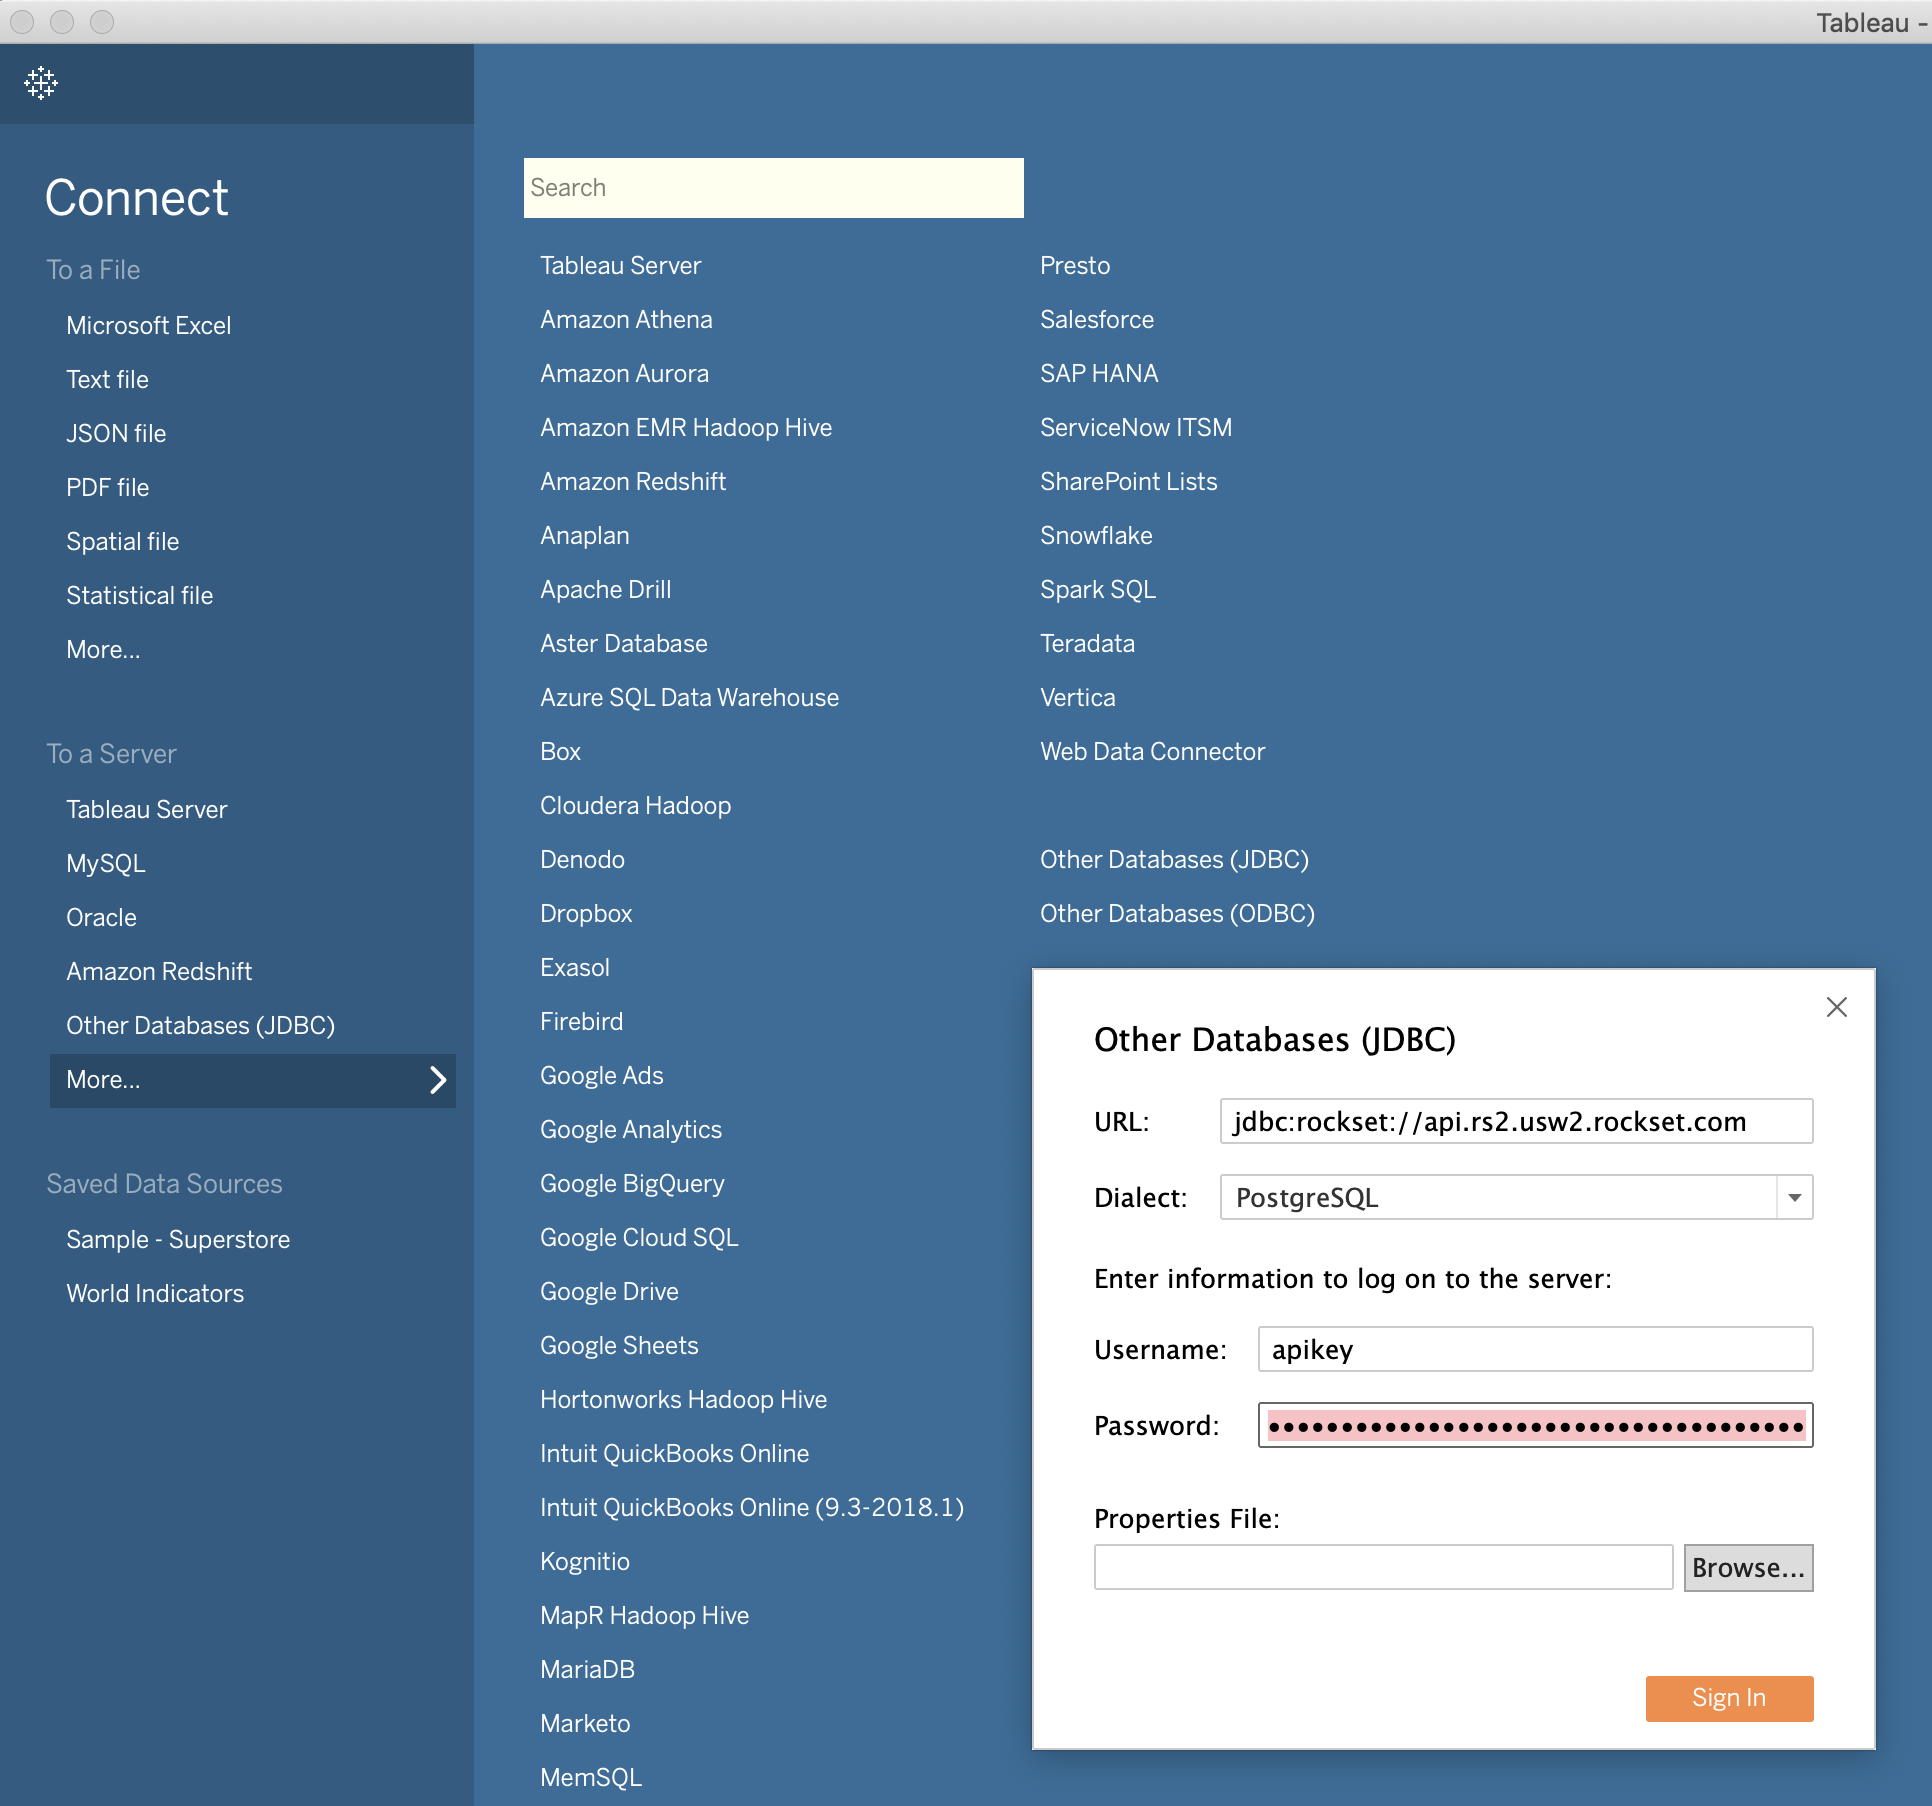
In Tableau, we connect to Rockset by choosing “Other Databases (JDBC)” and filling the fields, with our API key as the password:
Finally, back in Rockset, we just create a new collection directly from the DynamoDB table:
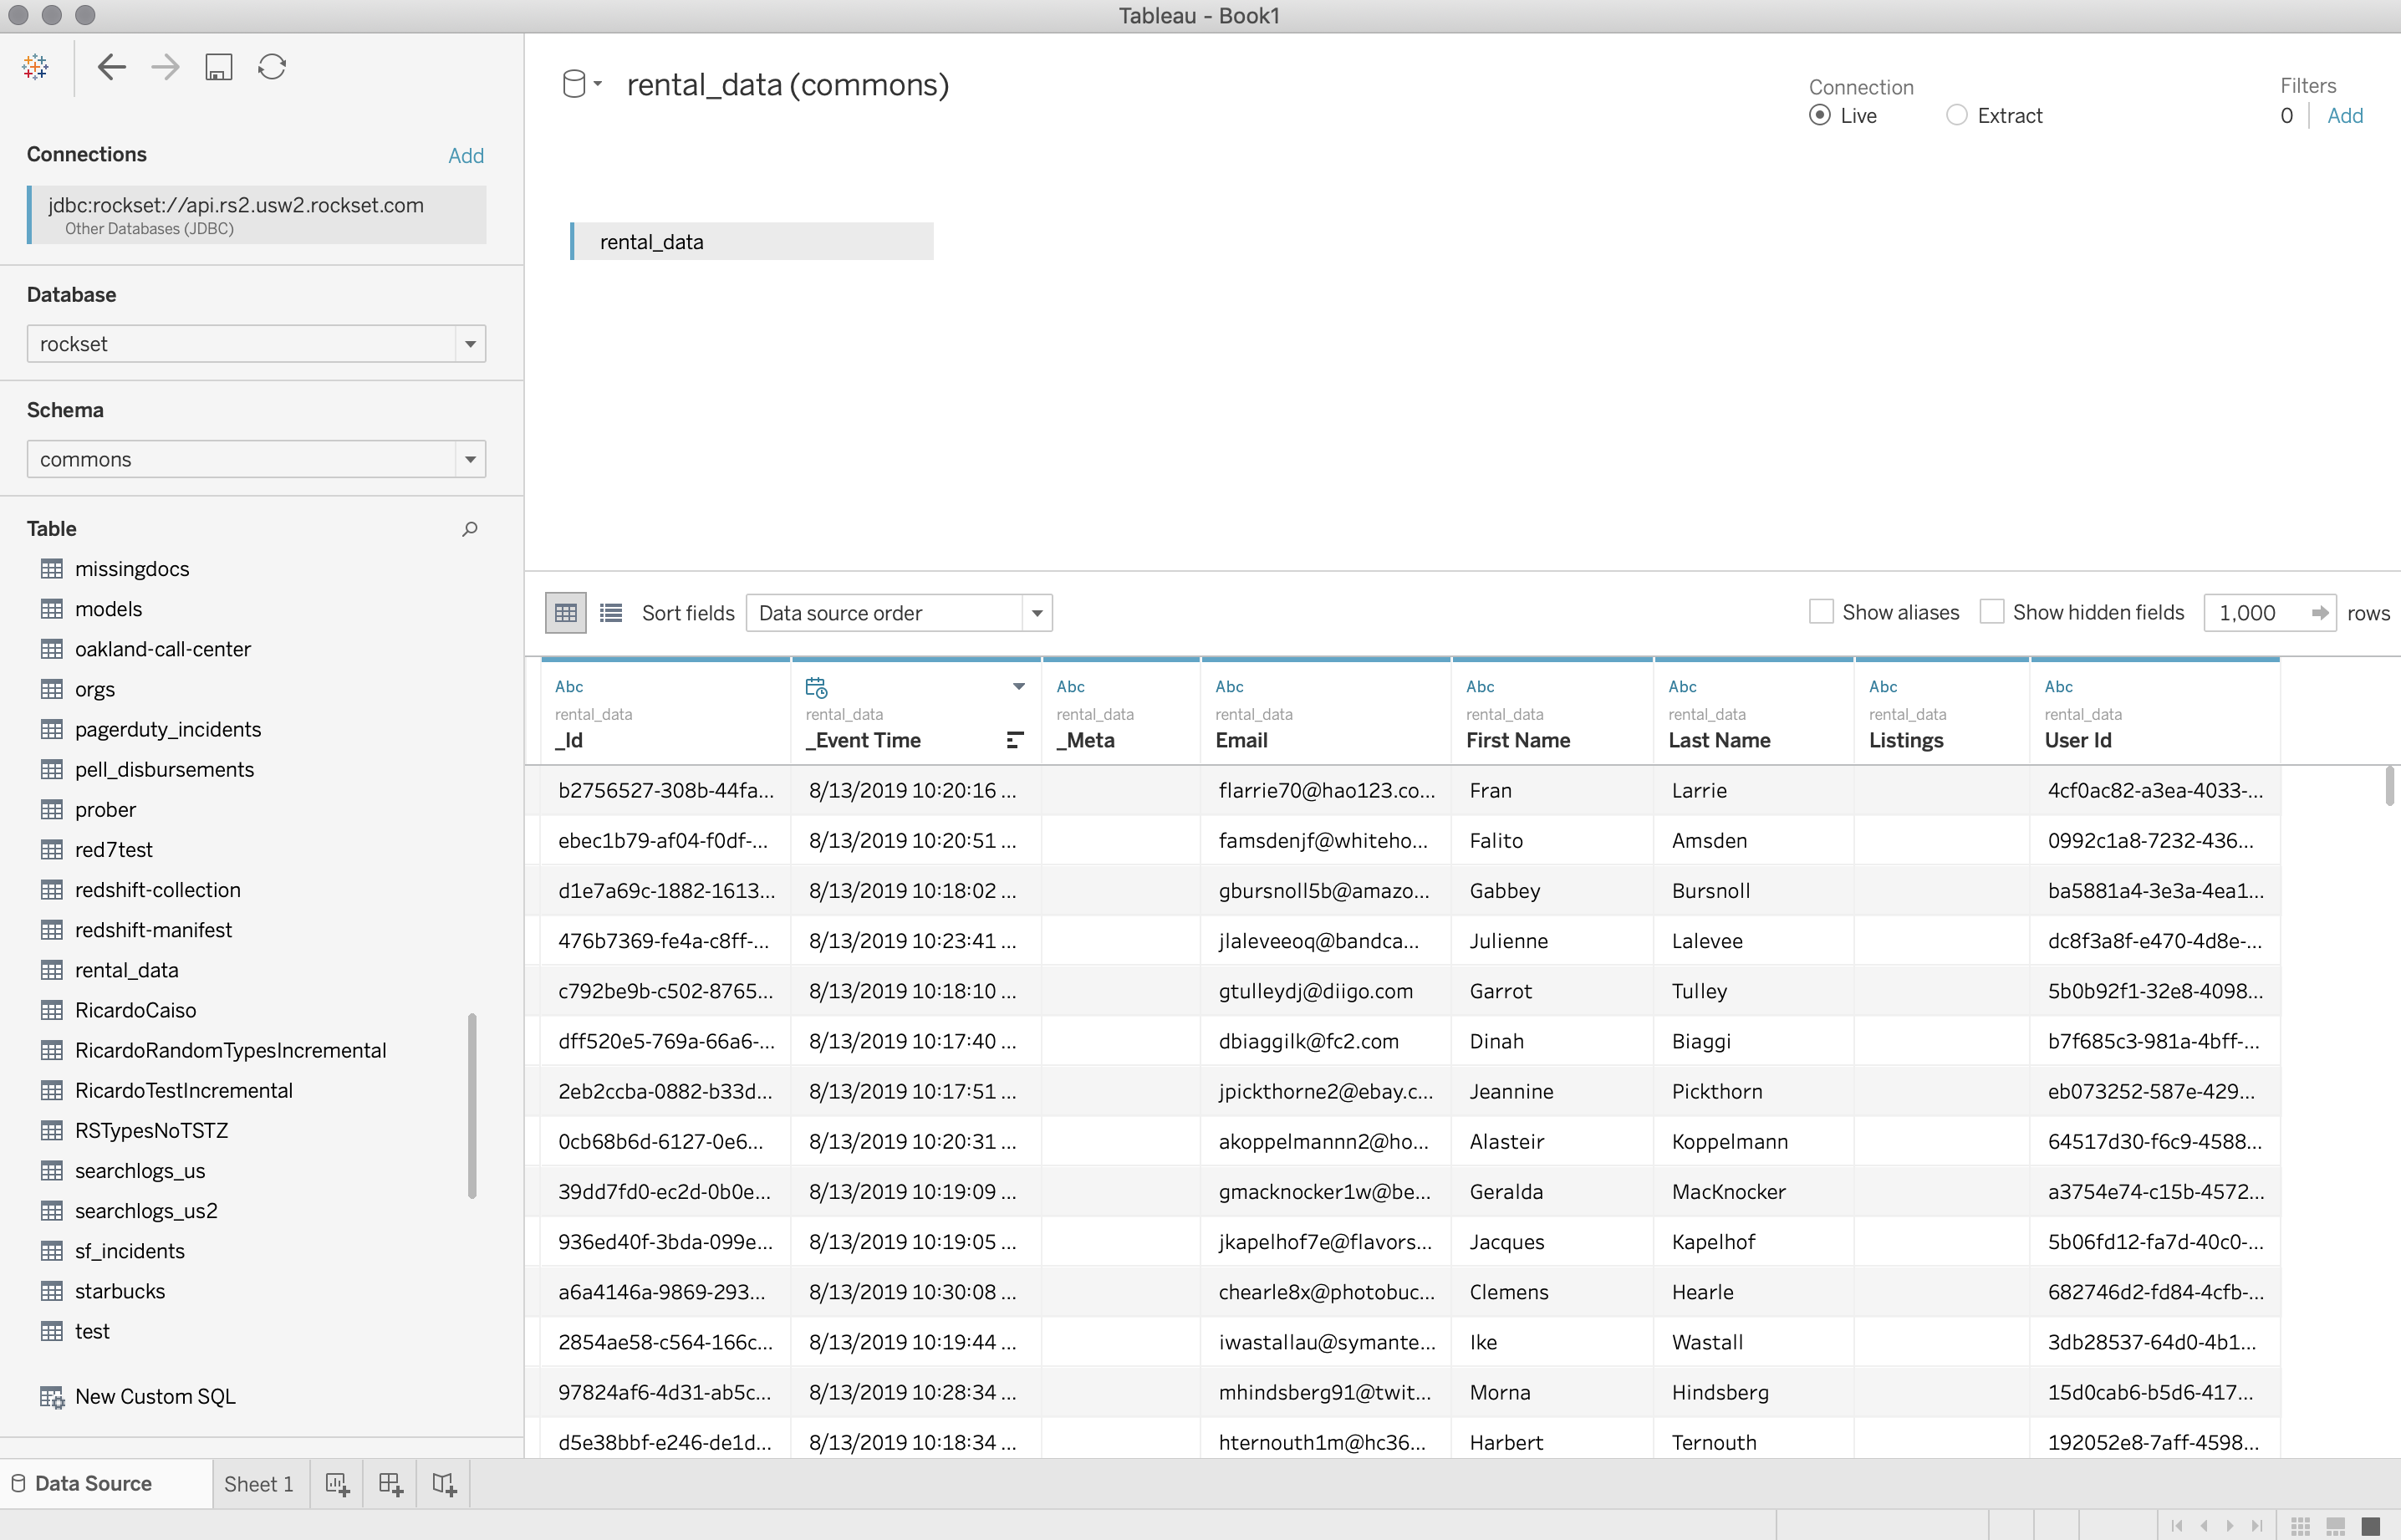
We see the new collection reflected as a table in Tableau:
Users Table
Our DynamoDB table has some fields of type Map and List, whereas Tableau expects a relational model where it can do joins on flat tables. To resolve this, we’ll compose SQL queries in the Rockset Console that reshapes the data as desired, and add these as custom SQL data sources in Tableau.
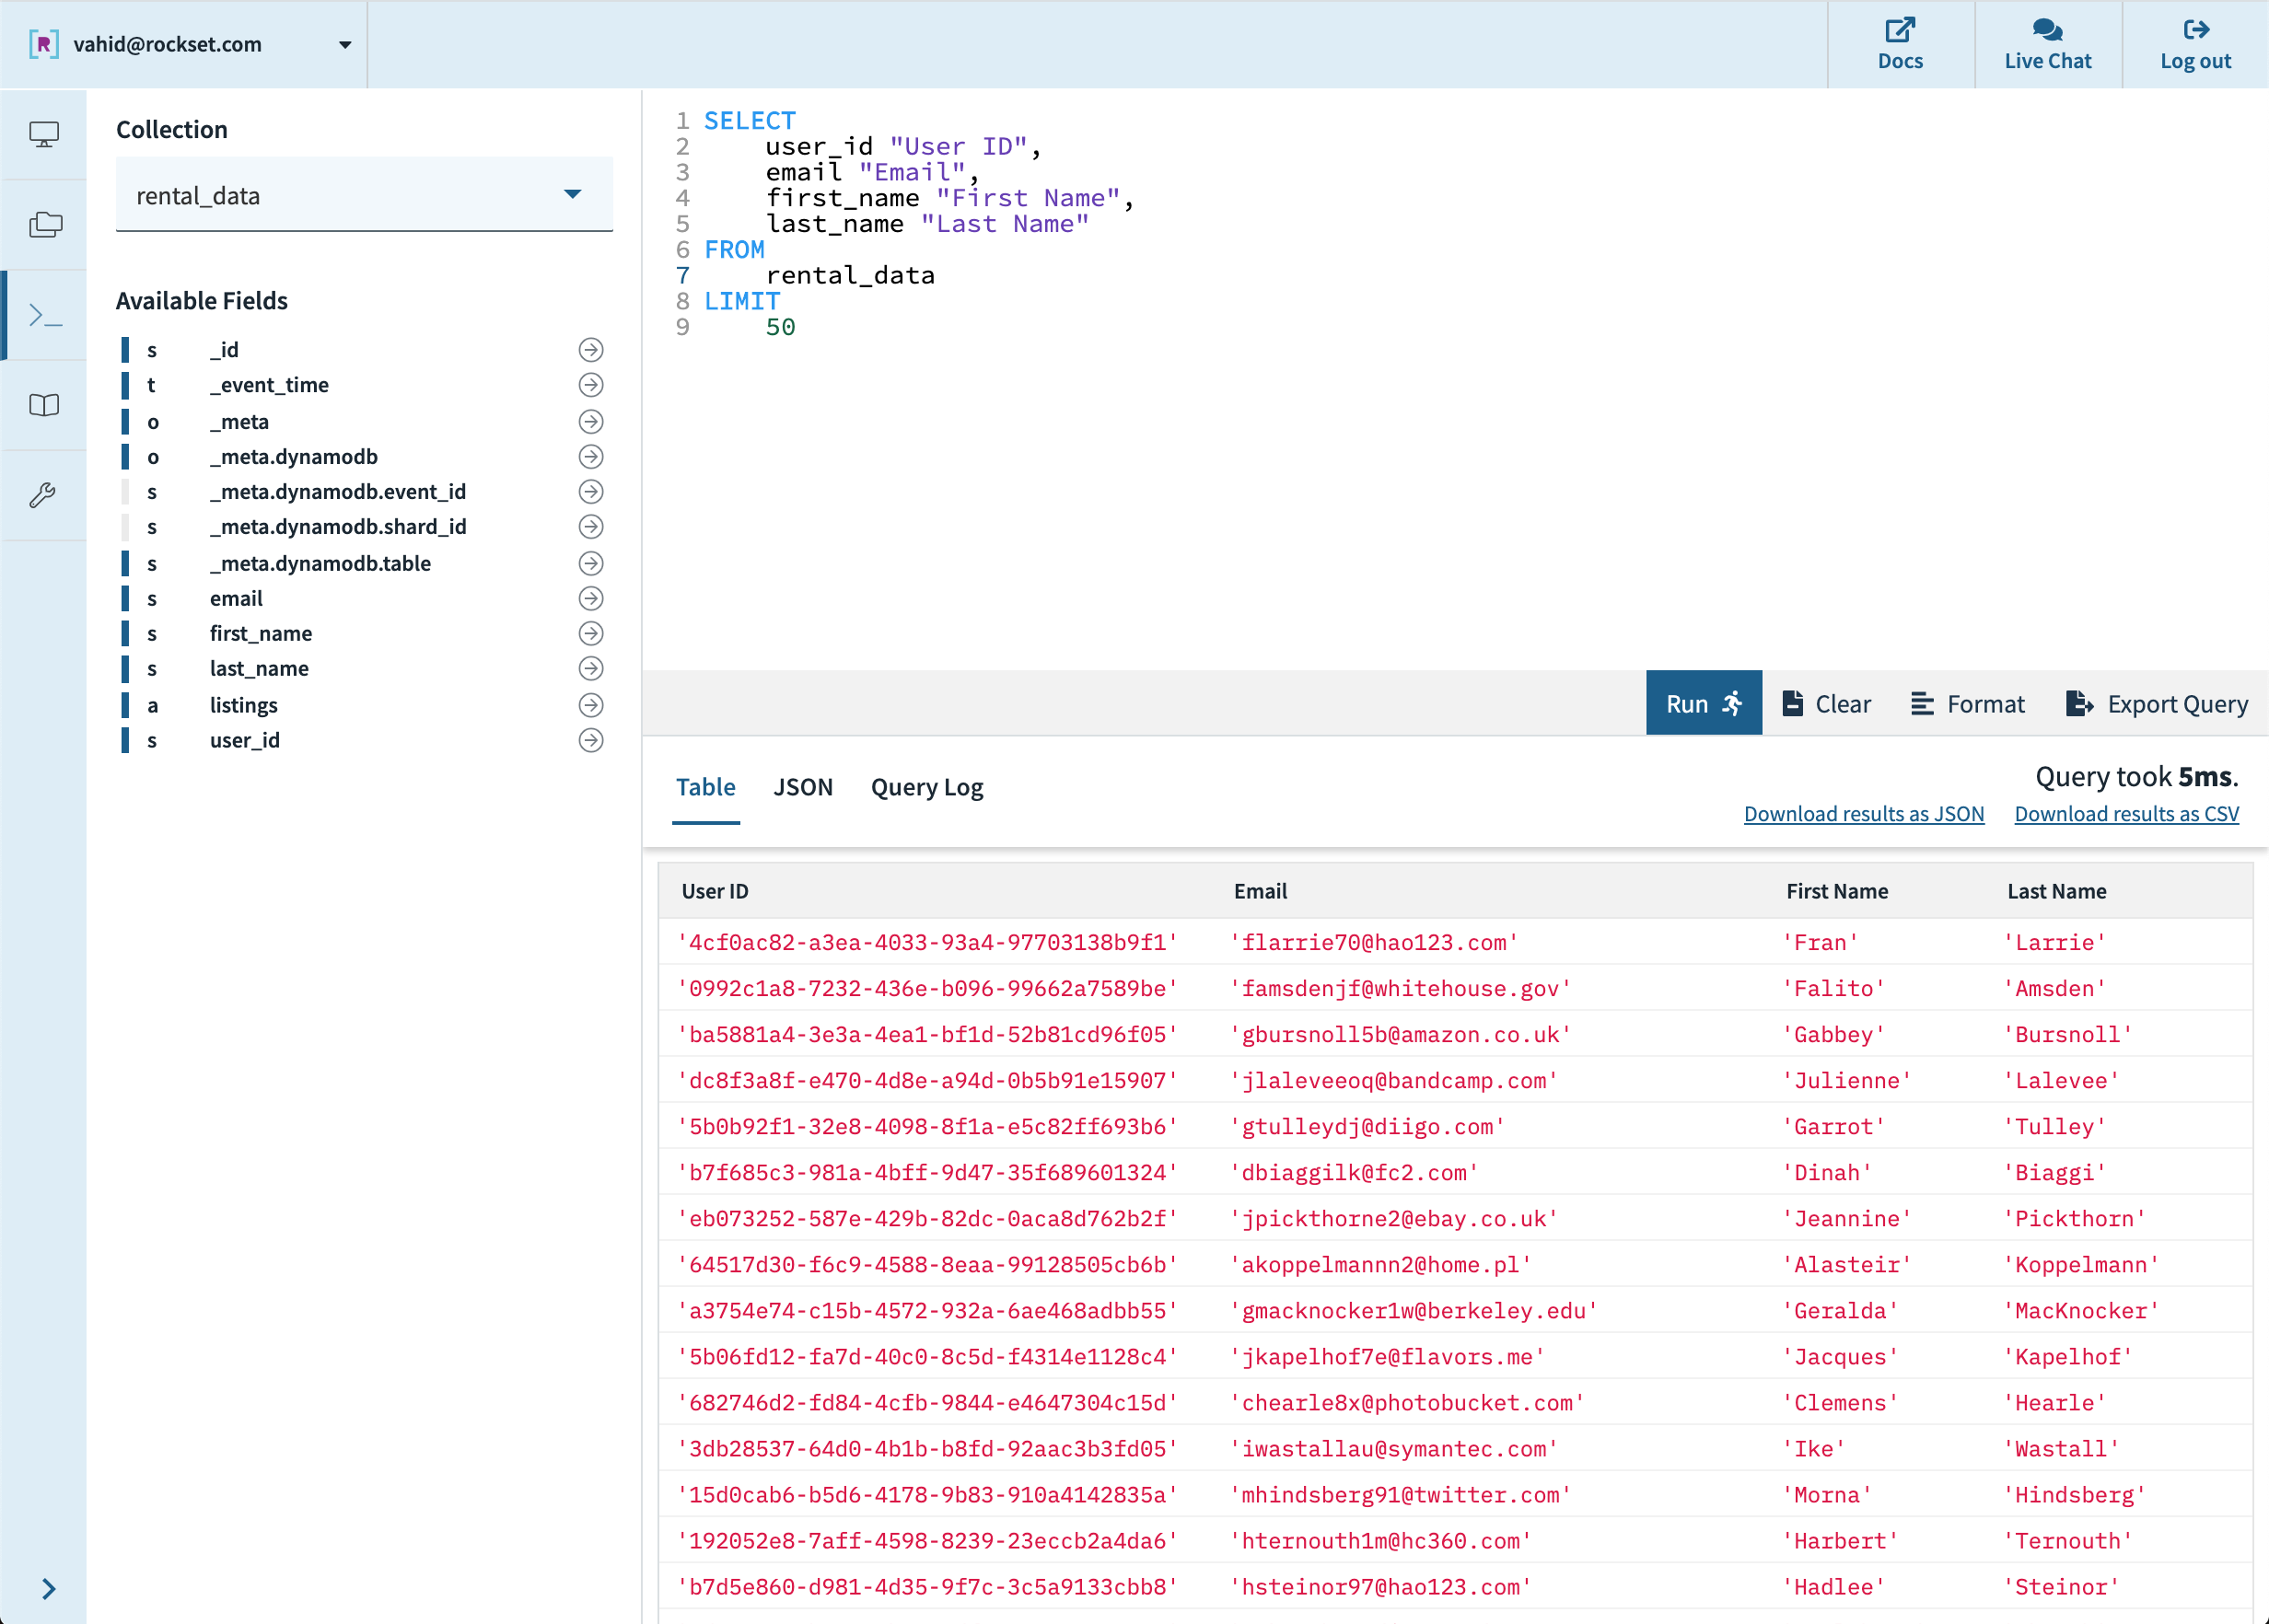
First, let’s just get a list of all the users on our rental platform:
In Tableau, we drag “New Custom SQL” to the top section, paste this query (without the LIMIT clause), and rename the result to Users:
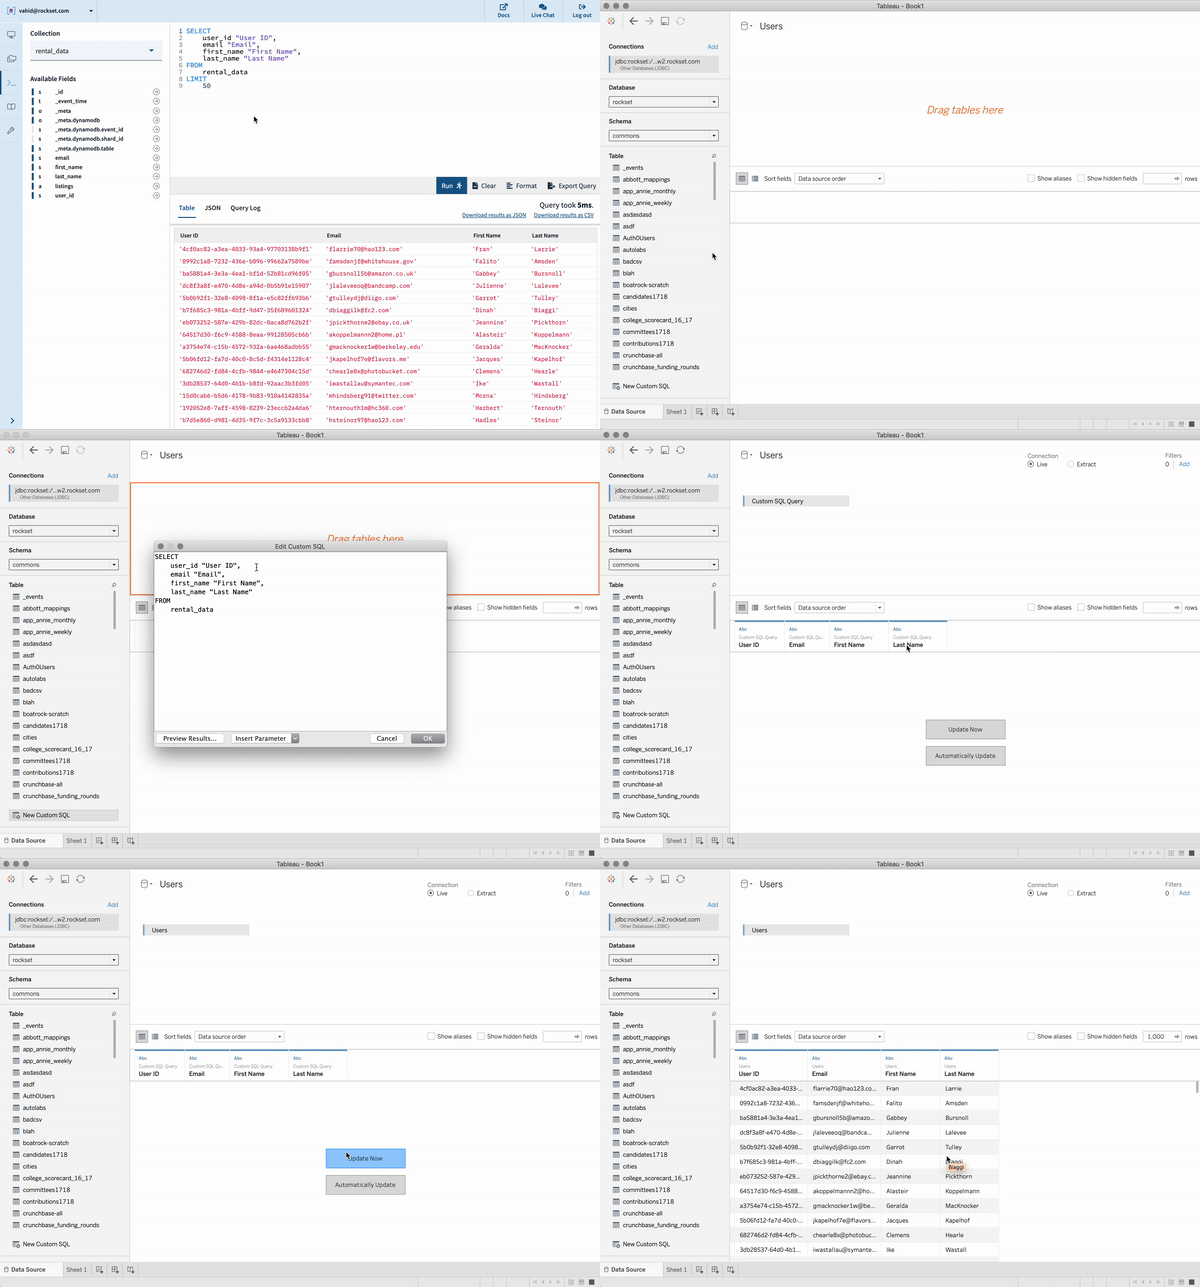
Looks good! Now, let’s repeat this process to also pull out listings and bookings into their own tables.
Listings Table
Note that in the original table, each row (user) has an array of listing items. We want to pull out these arrays and concatenate them such that each item itself becomes a row. To do so, we can use the UNNEST function:
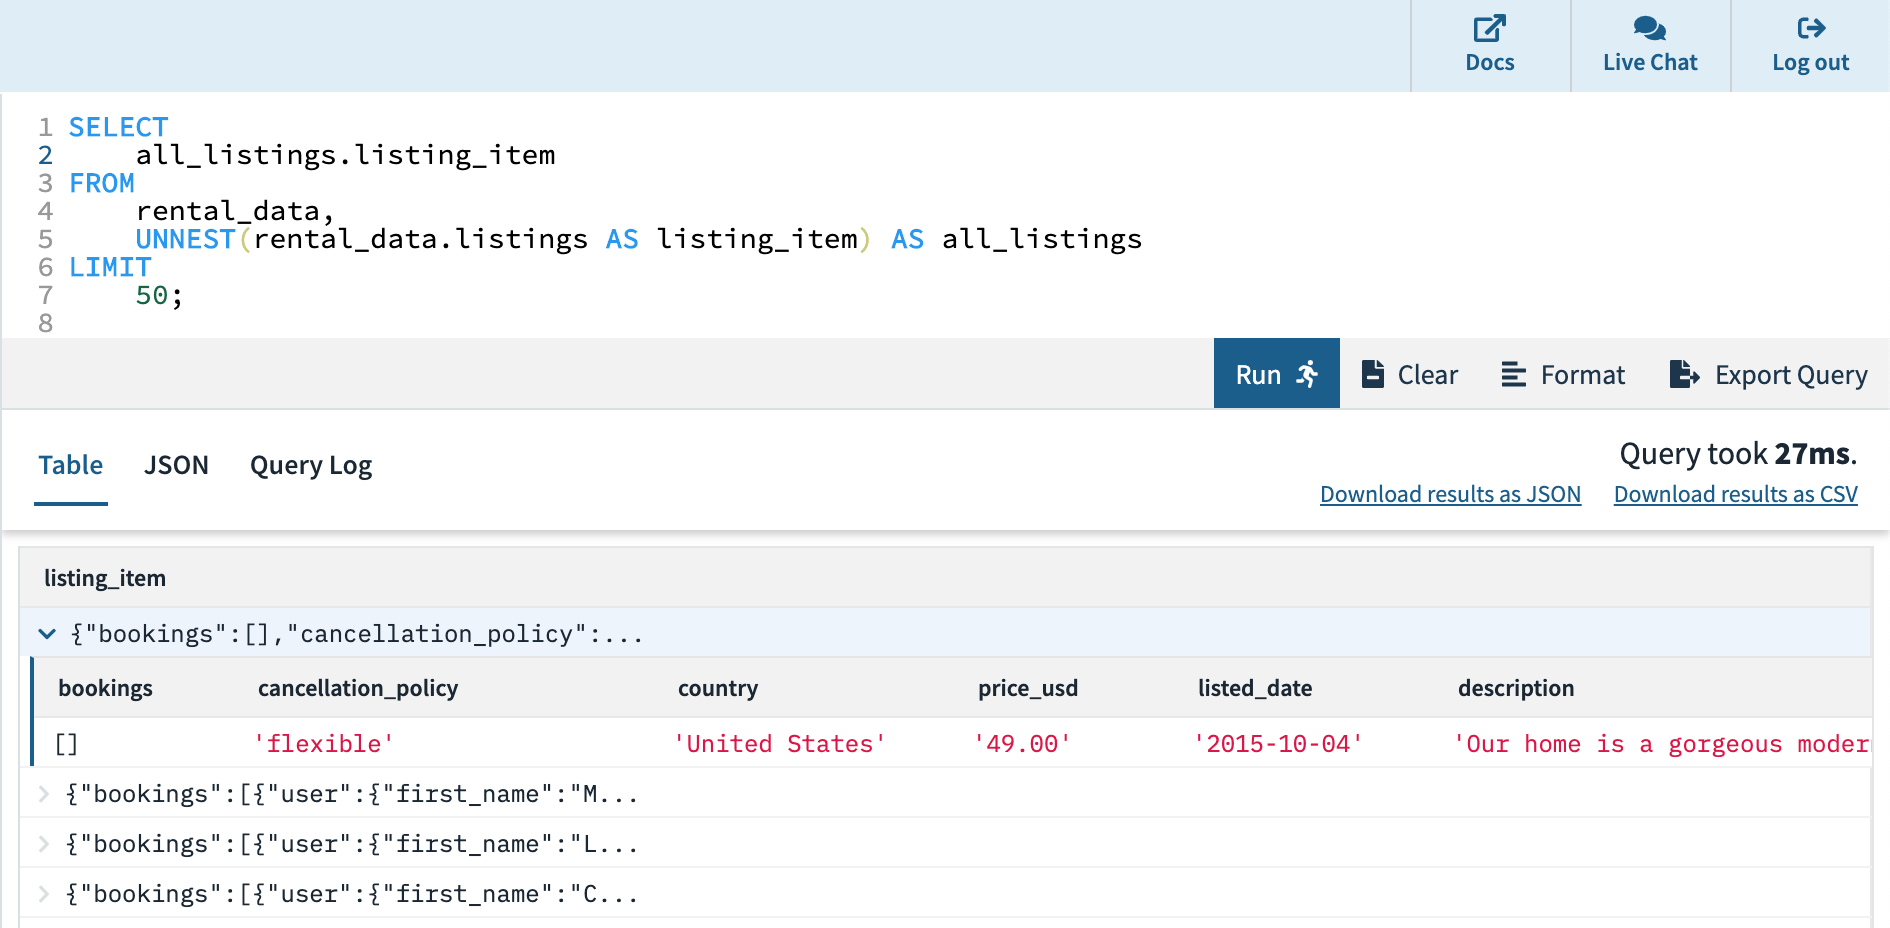
Now, let’s select the fields we want to have in our listings table:

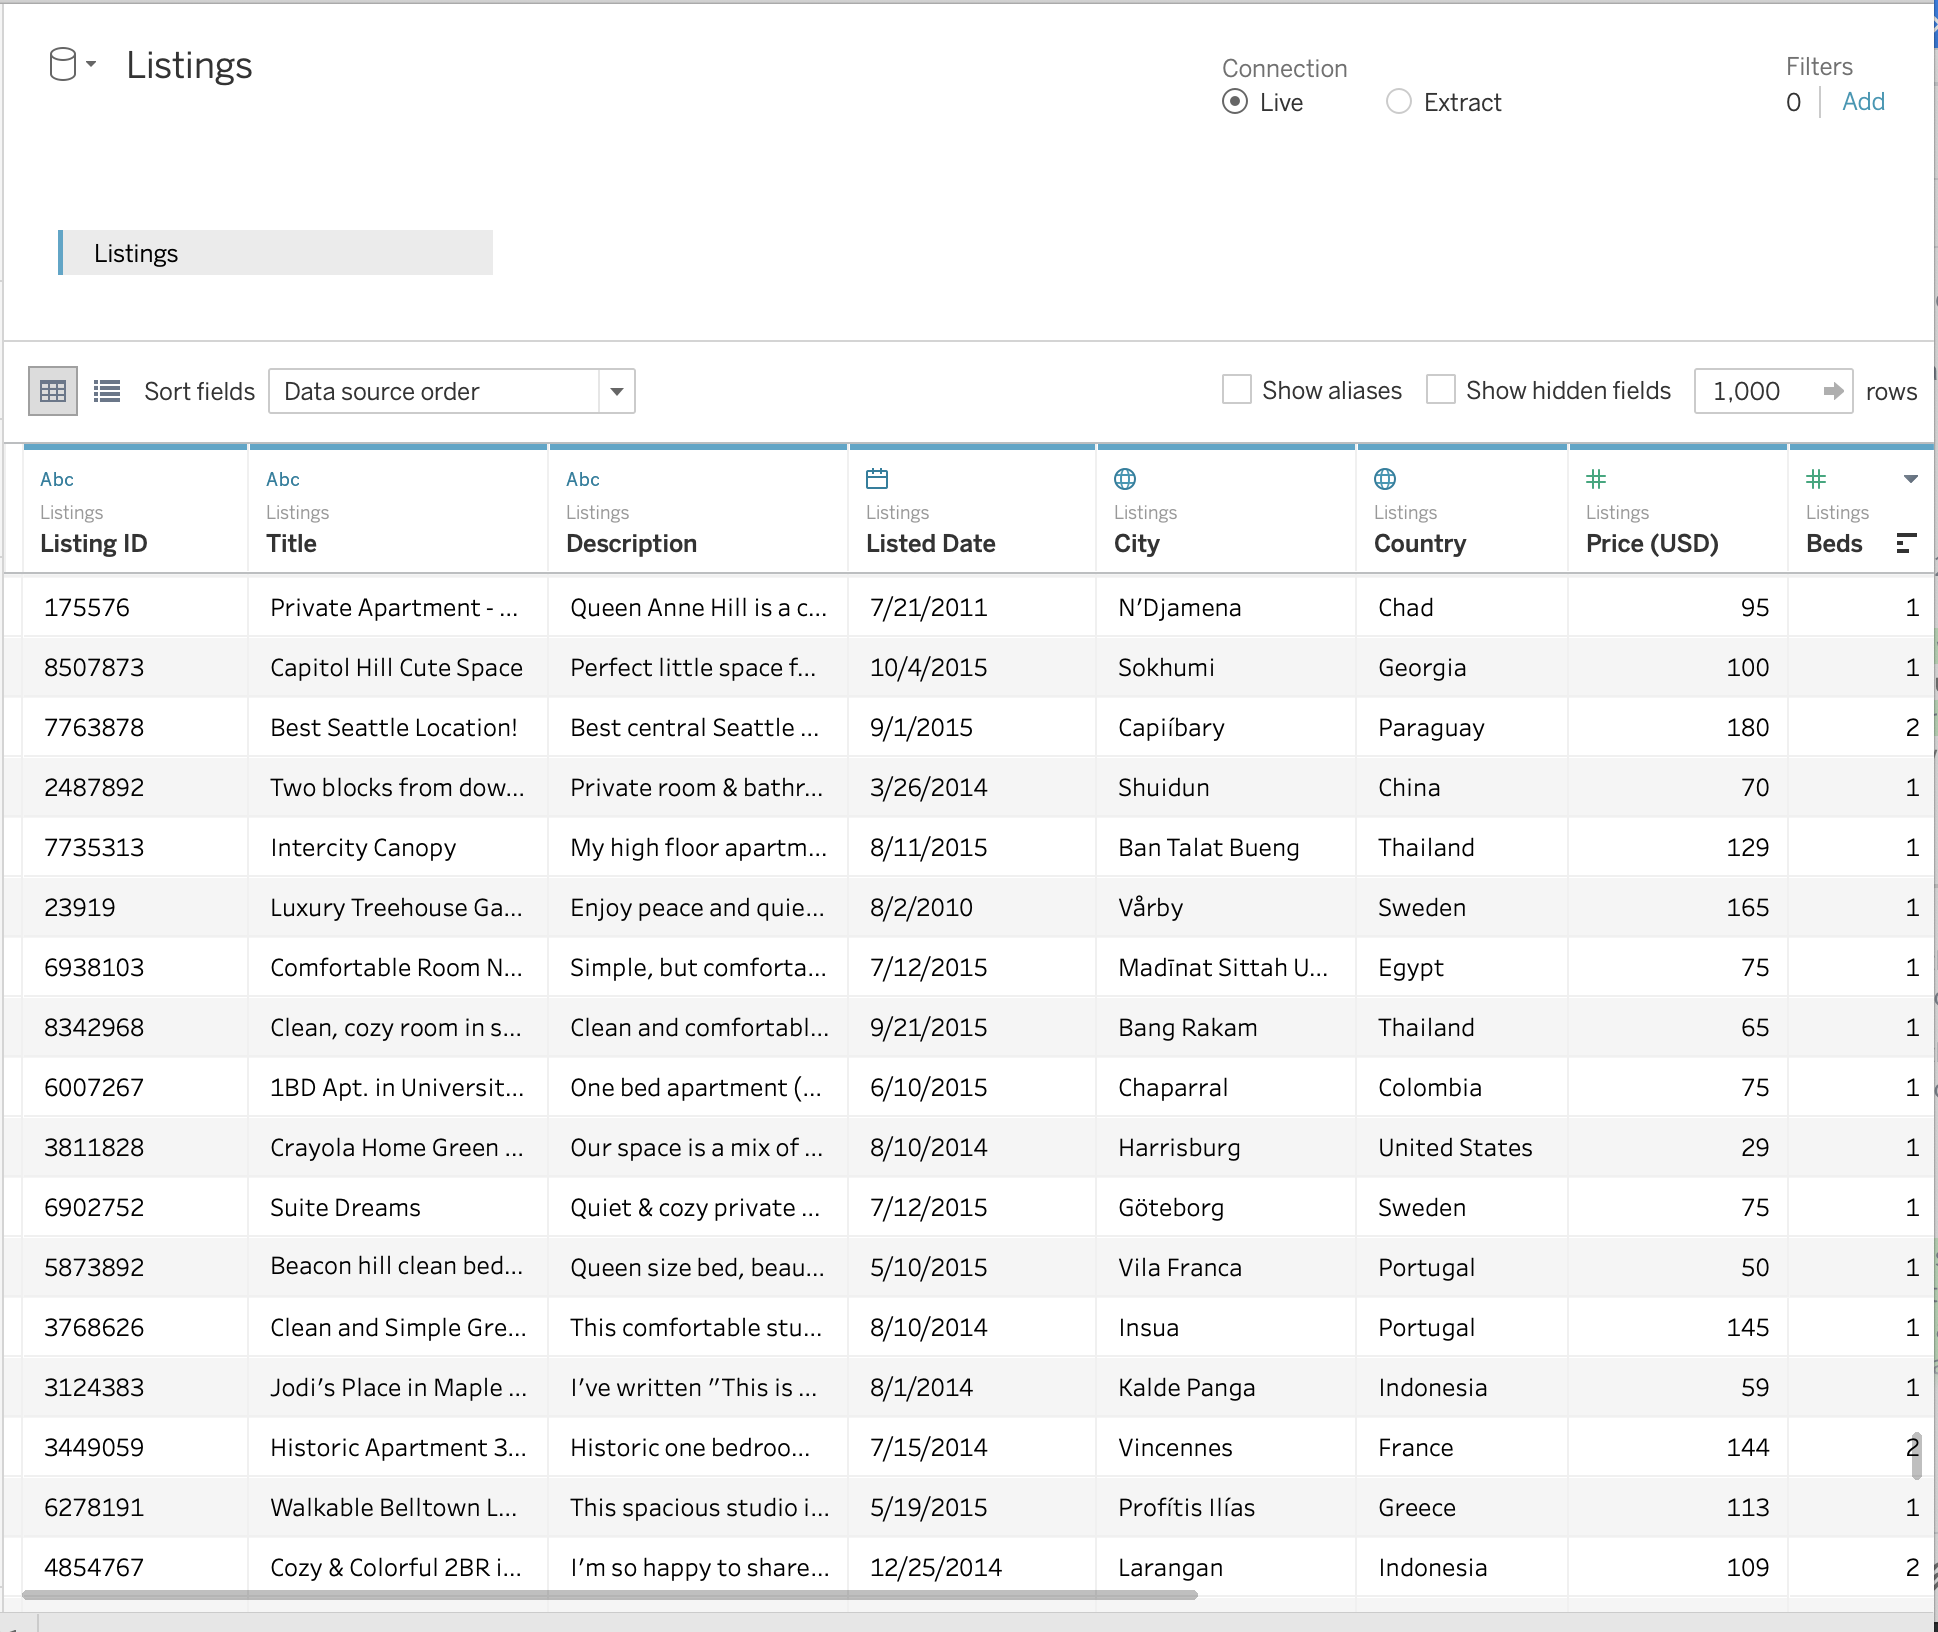
And we paste this as custom SQL in Tableau to get our Listings table:
Bookings Table
Let’s create one more data source for our Bookings table with another UNNEST query:
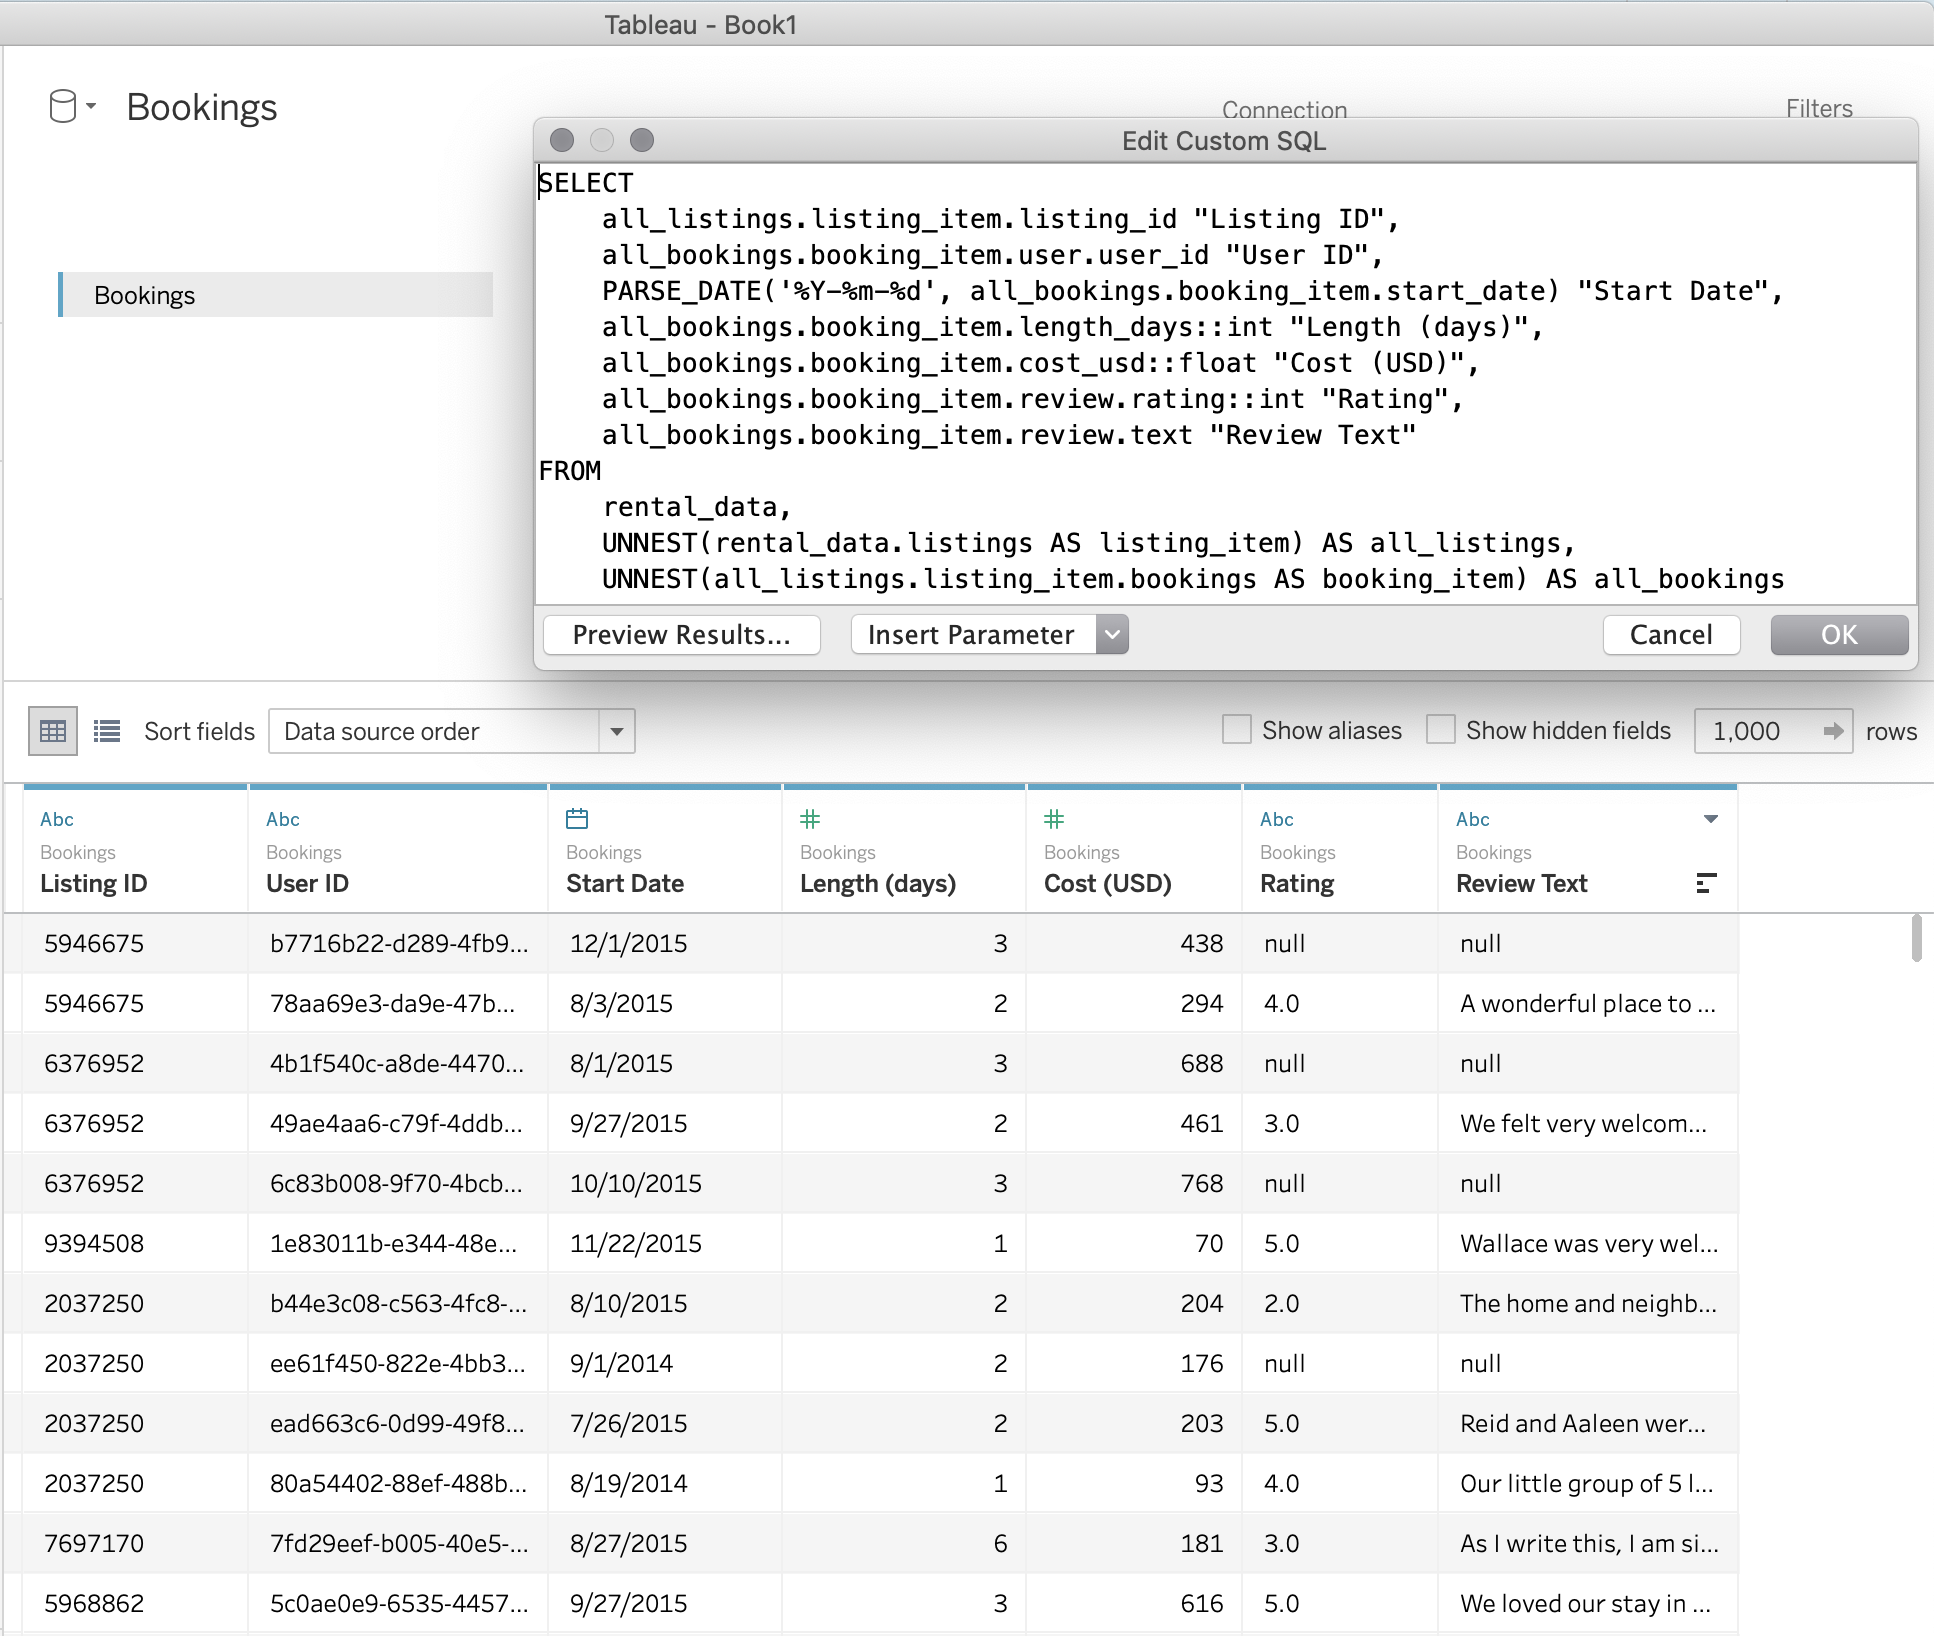
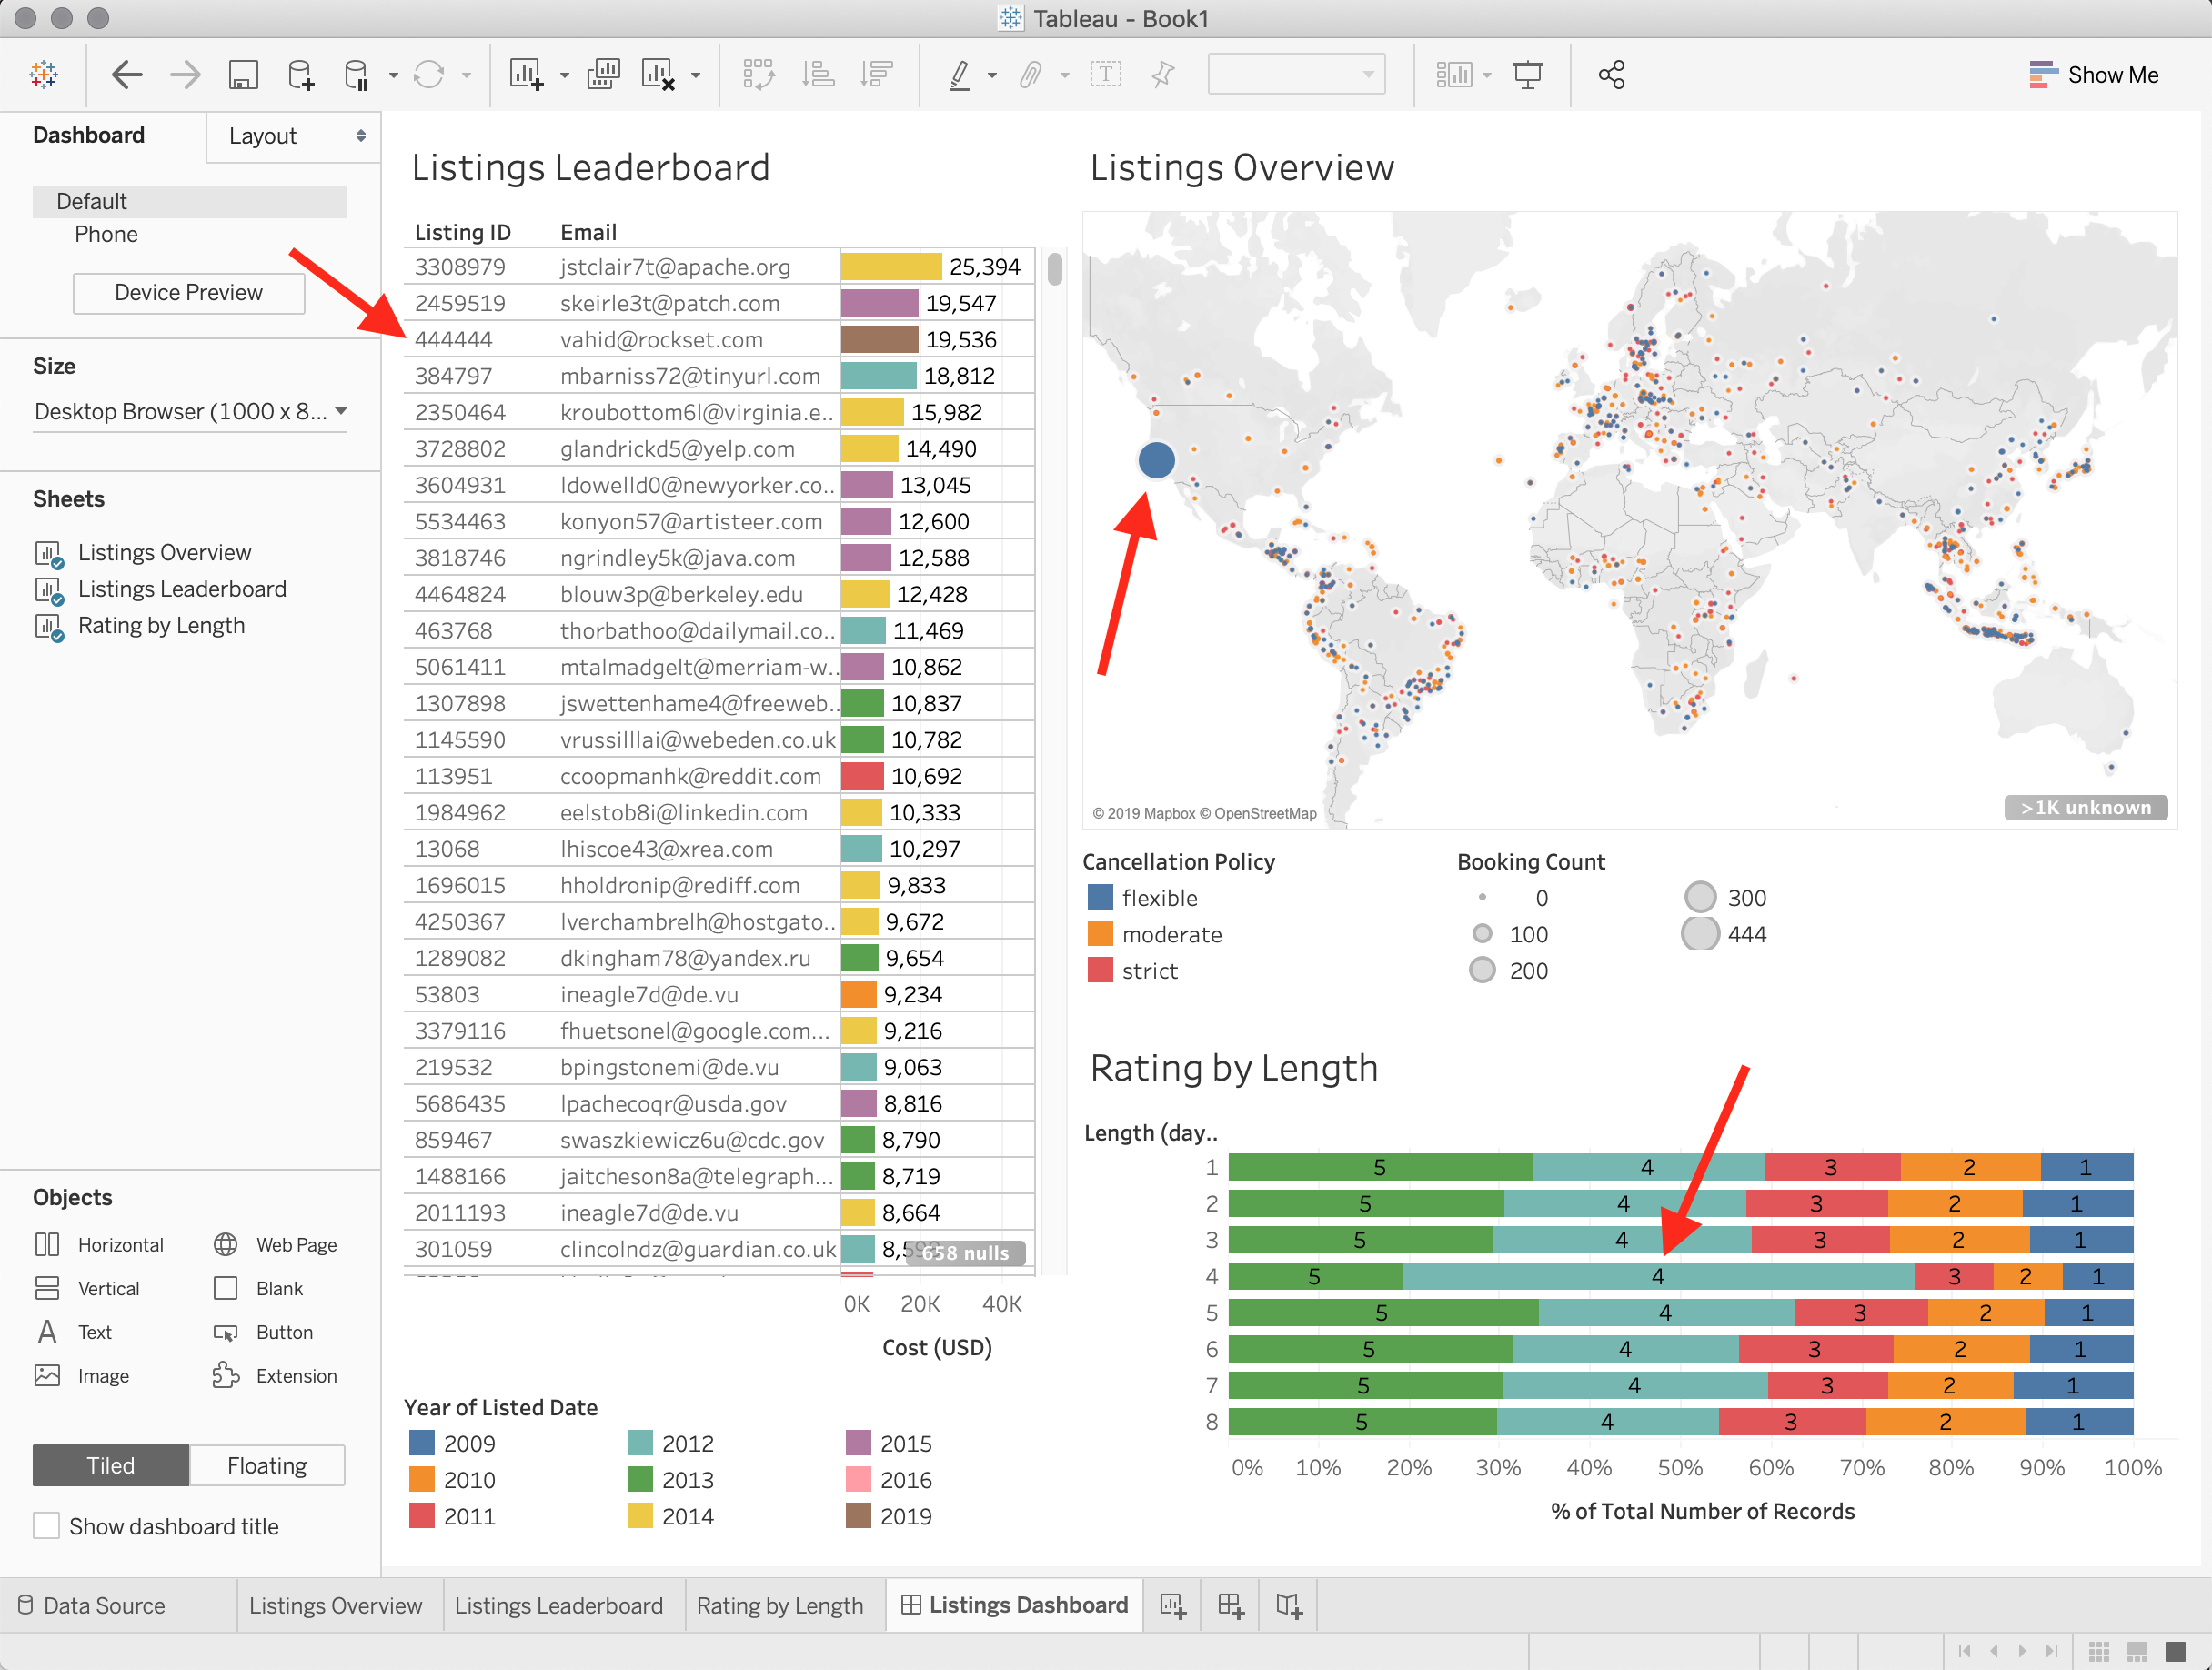
Chart 1: Listings Overview
Let’s get a high level view of the listings around the world on our platform. With a few drag-and-drops, we use the city/country to place the listings on a map, sized by booking count and colored by cancellation policy.
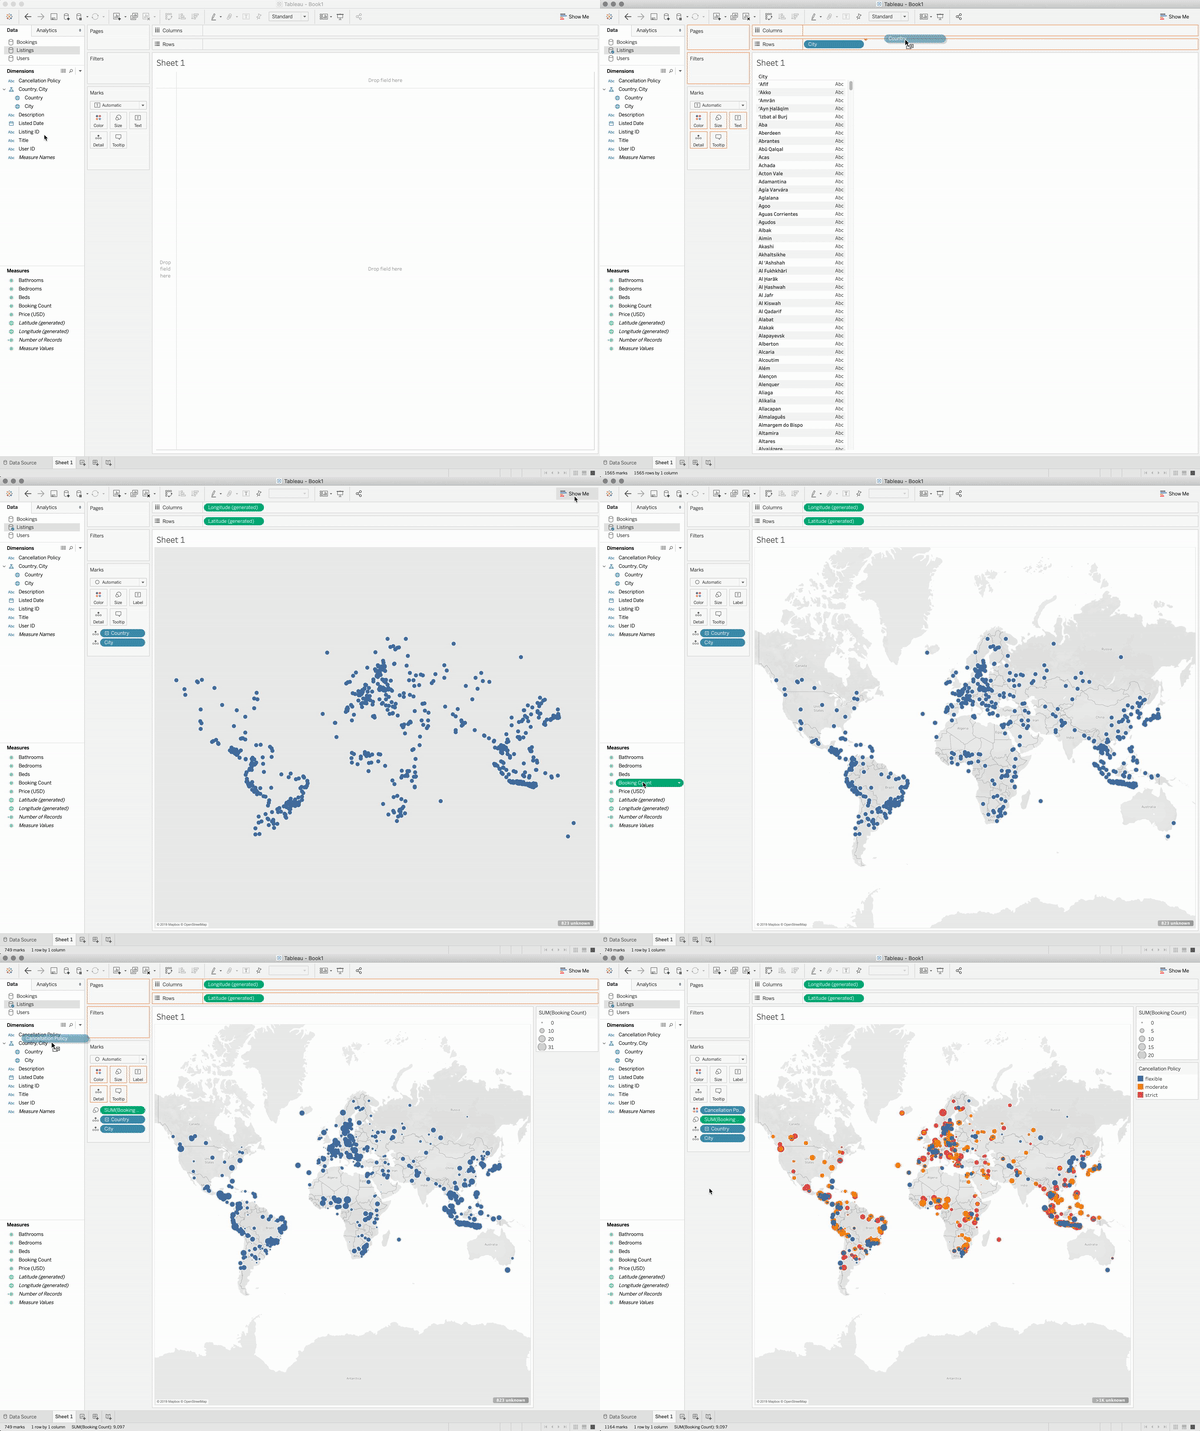
Looks like we have a lot of listings in Europe, South America, and East Asia.
Chart 2: Listings Leaderboard
Let’s try to find out more about the listings pulling in the most revenue. We’ll build a leaderboard with the following information:
- labeled by listing ID and email of host
- total revenue as the sum of cost across all bookings (sorted from highest to lowest)
- colored by year it was listed
- details about title, description, and number of beds shown on hover
Note that to accomplish this, we have to combine information across all three of our tables, but we can do so directly in Tableau.
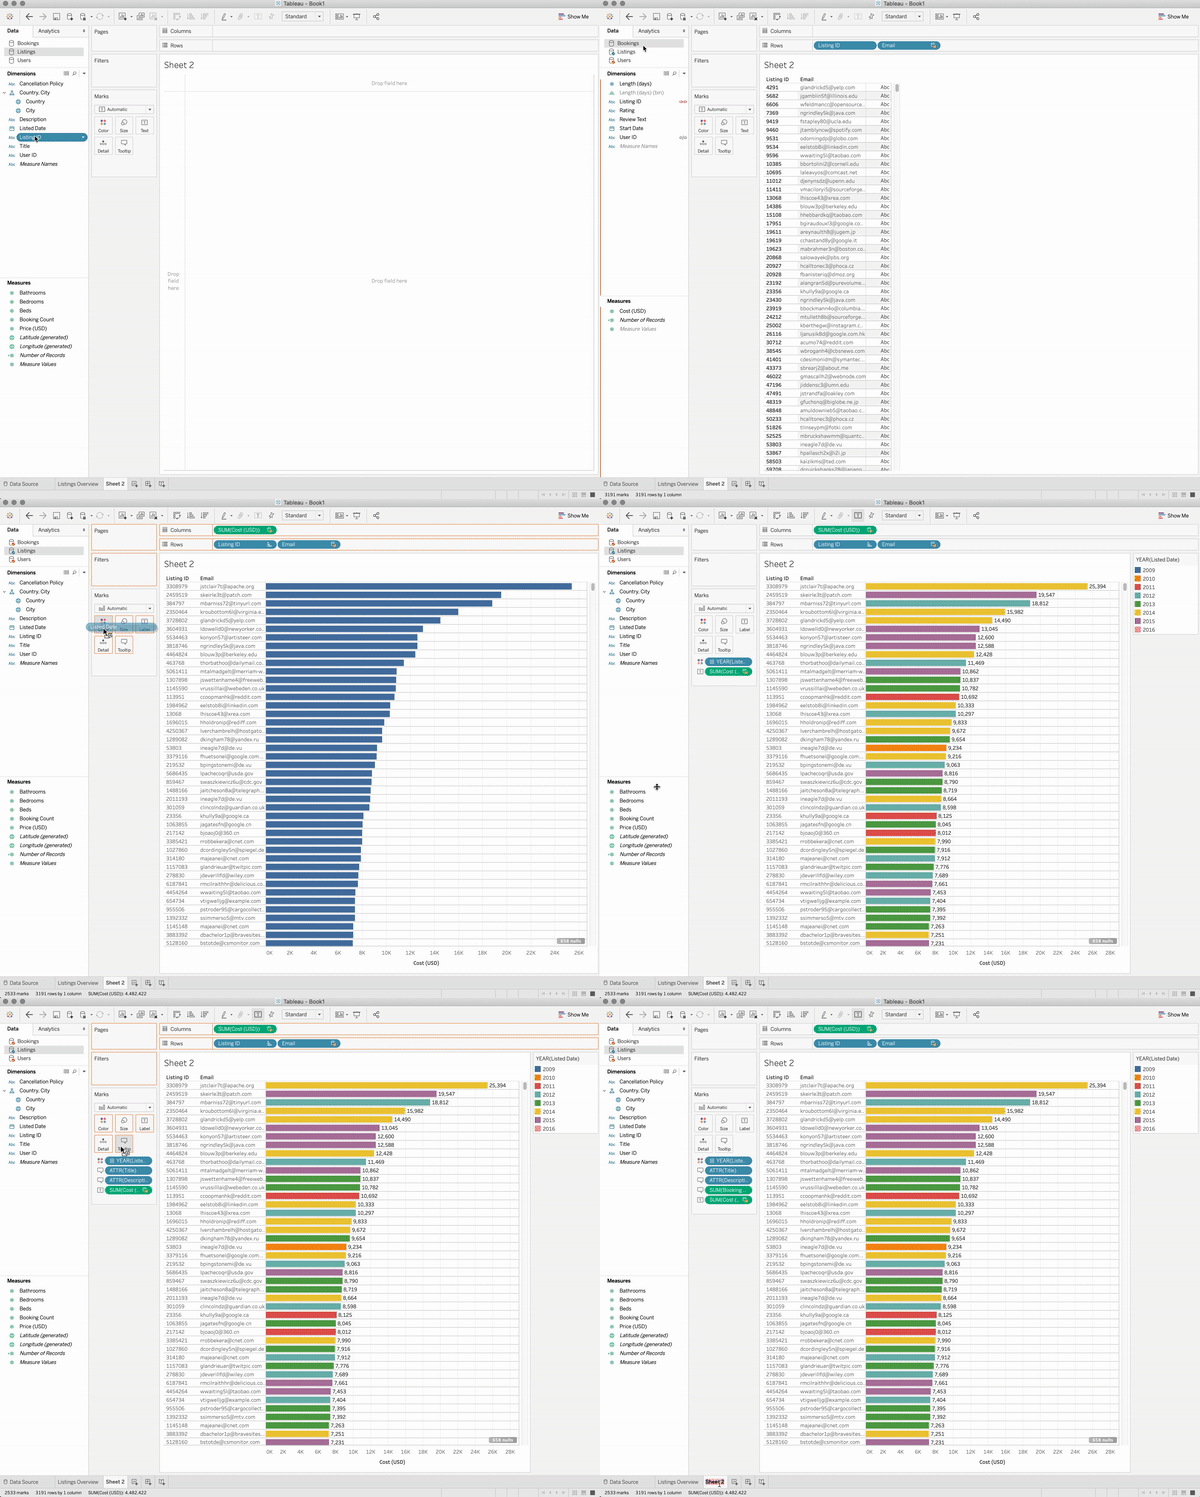
Chart 3: Rating by Length
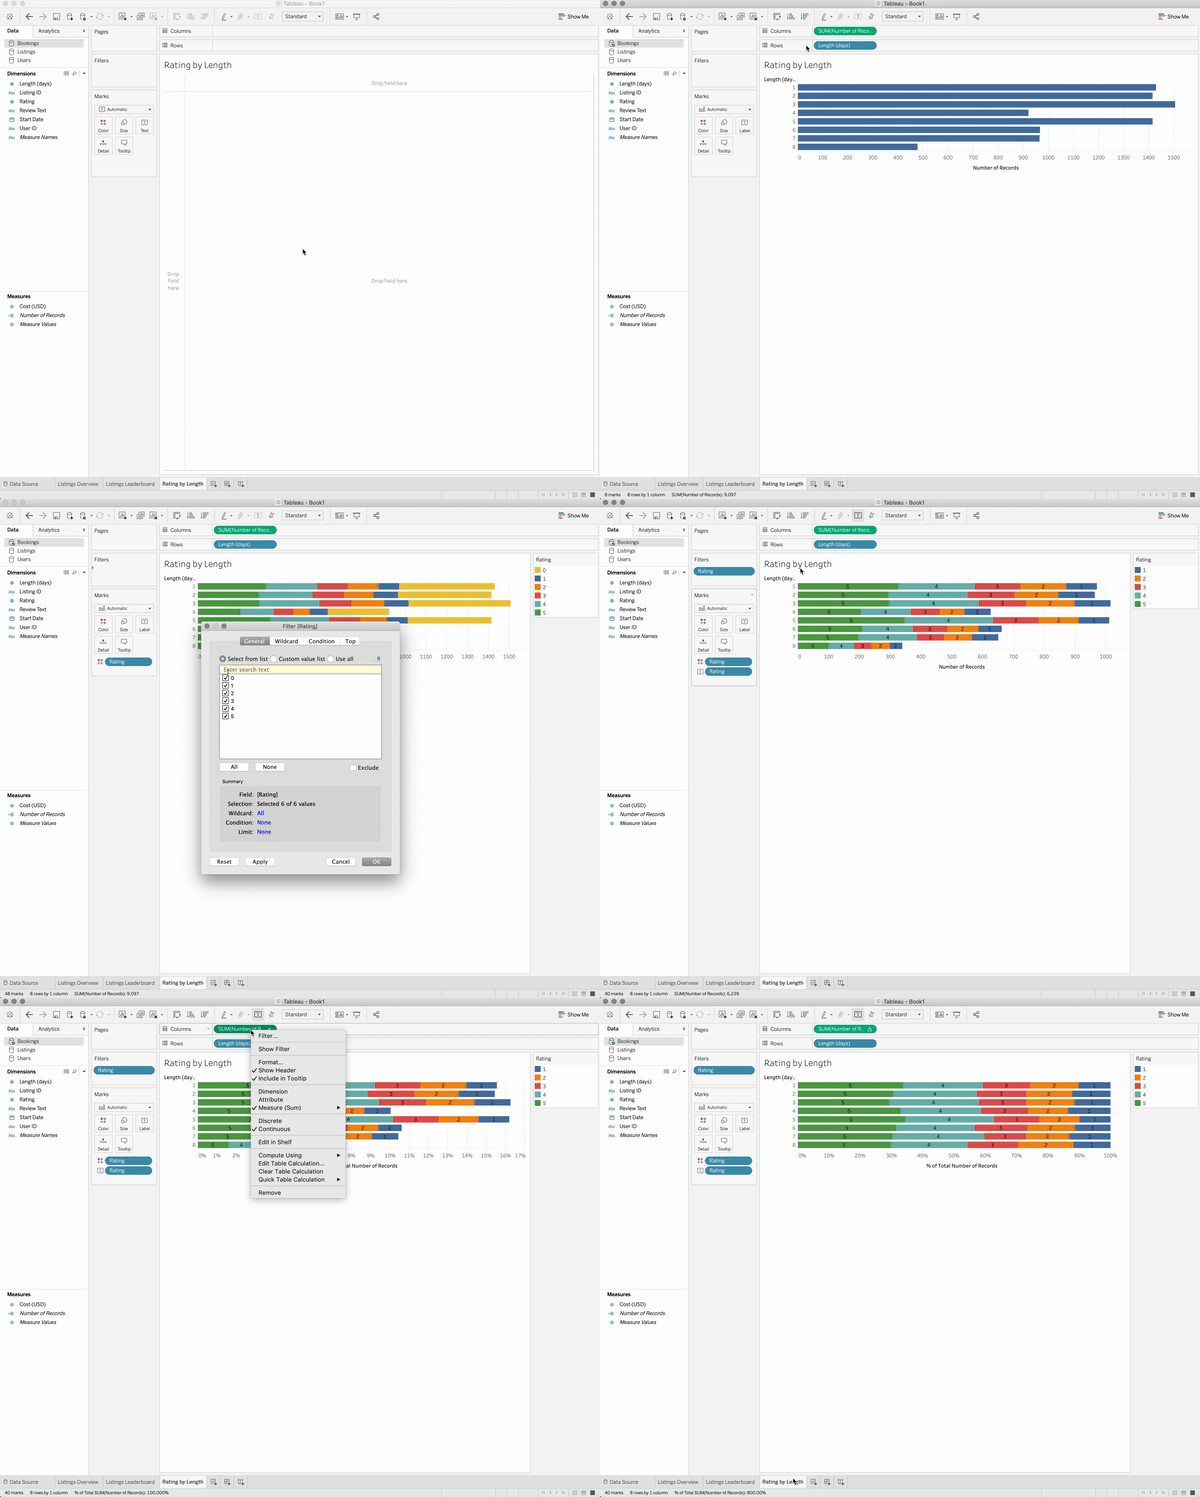
Next, suppose we want to know what kind of users our platform is pleasing the most. Let’s look at the average rating for each of the different lengths of bookings.
User Dashboard on Real-Time Data
Let’s throw all these charts together in a dashboard:
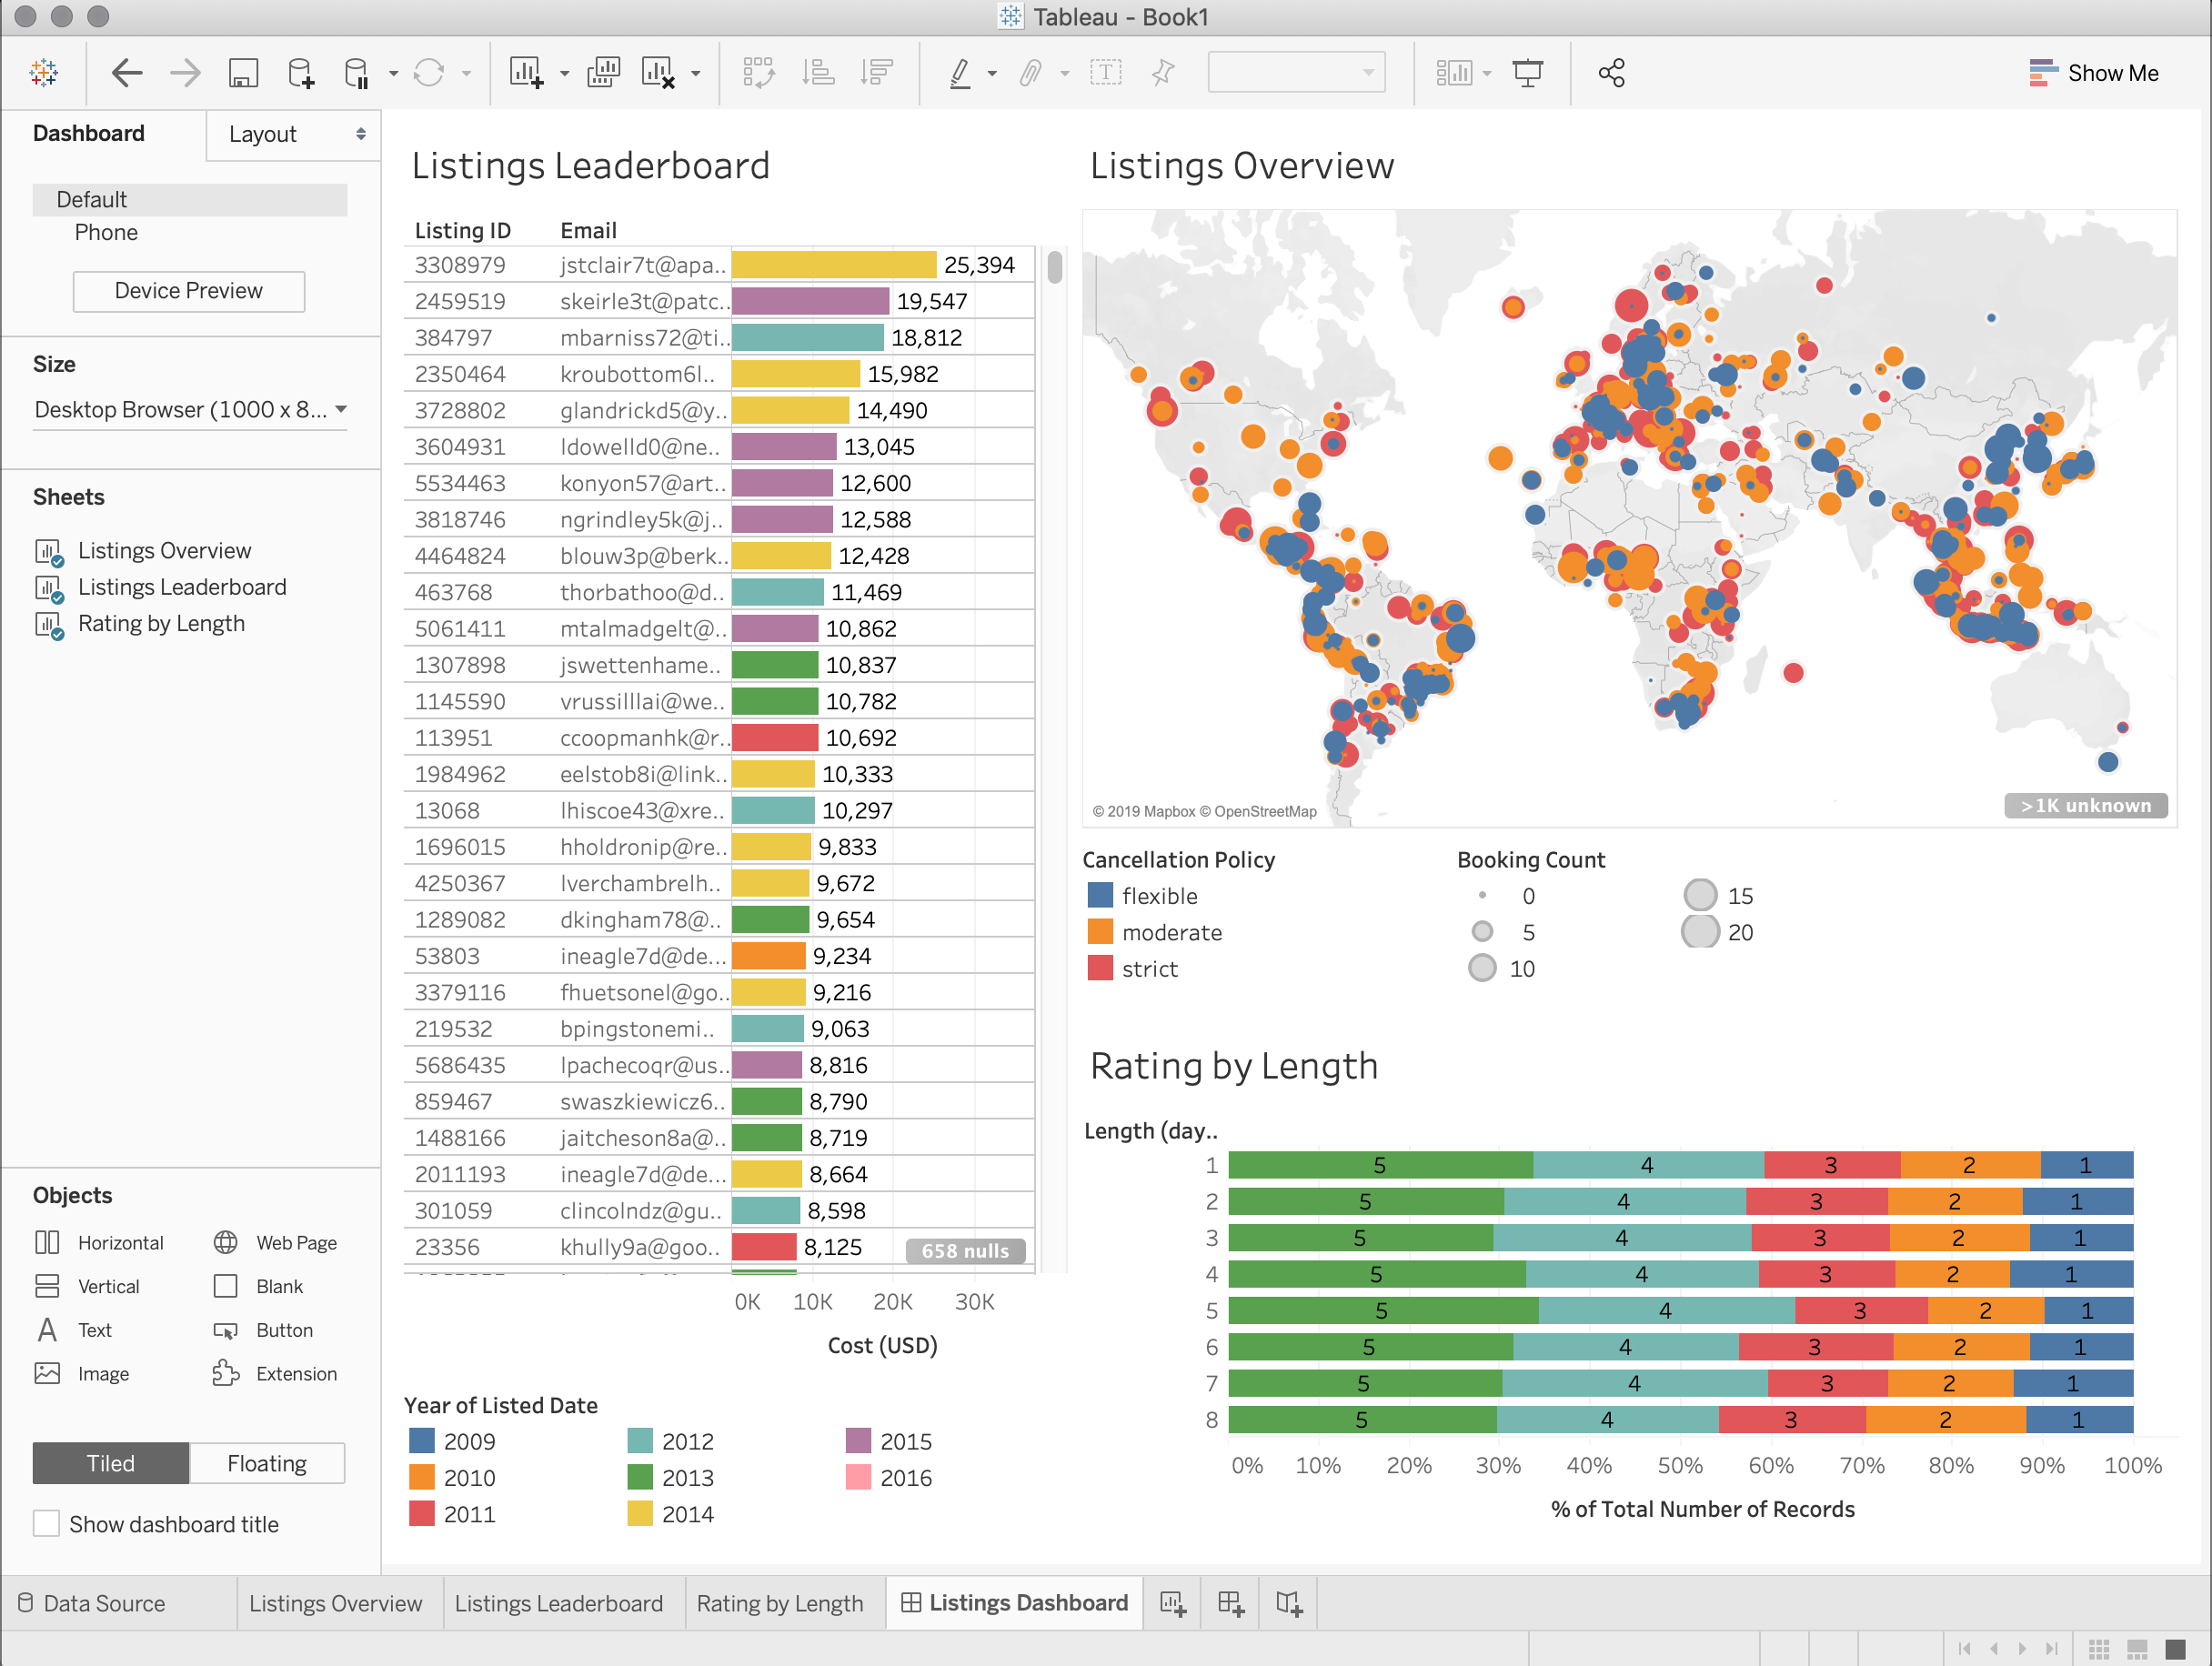
You may notice the ratings by length are roughly the same between length of stay—and that’s because the mock data was generated for each length from the same rating distribution!
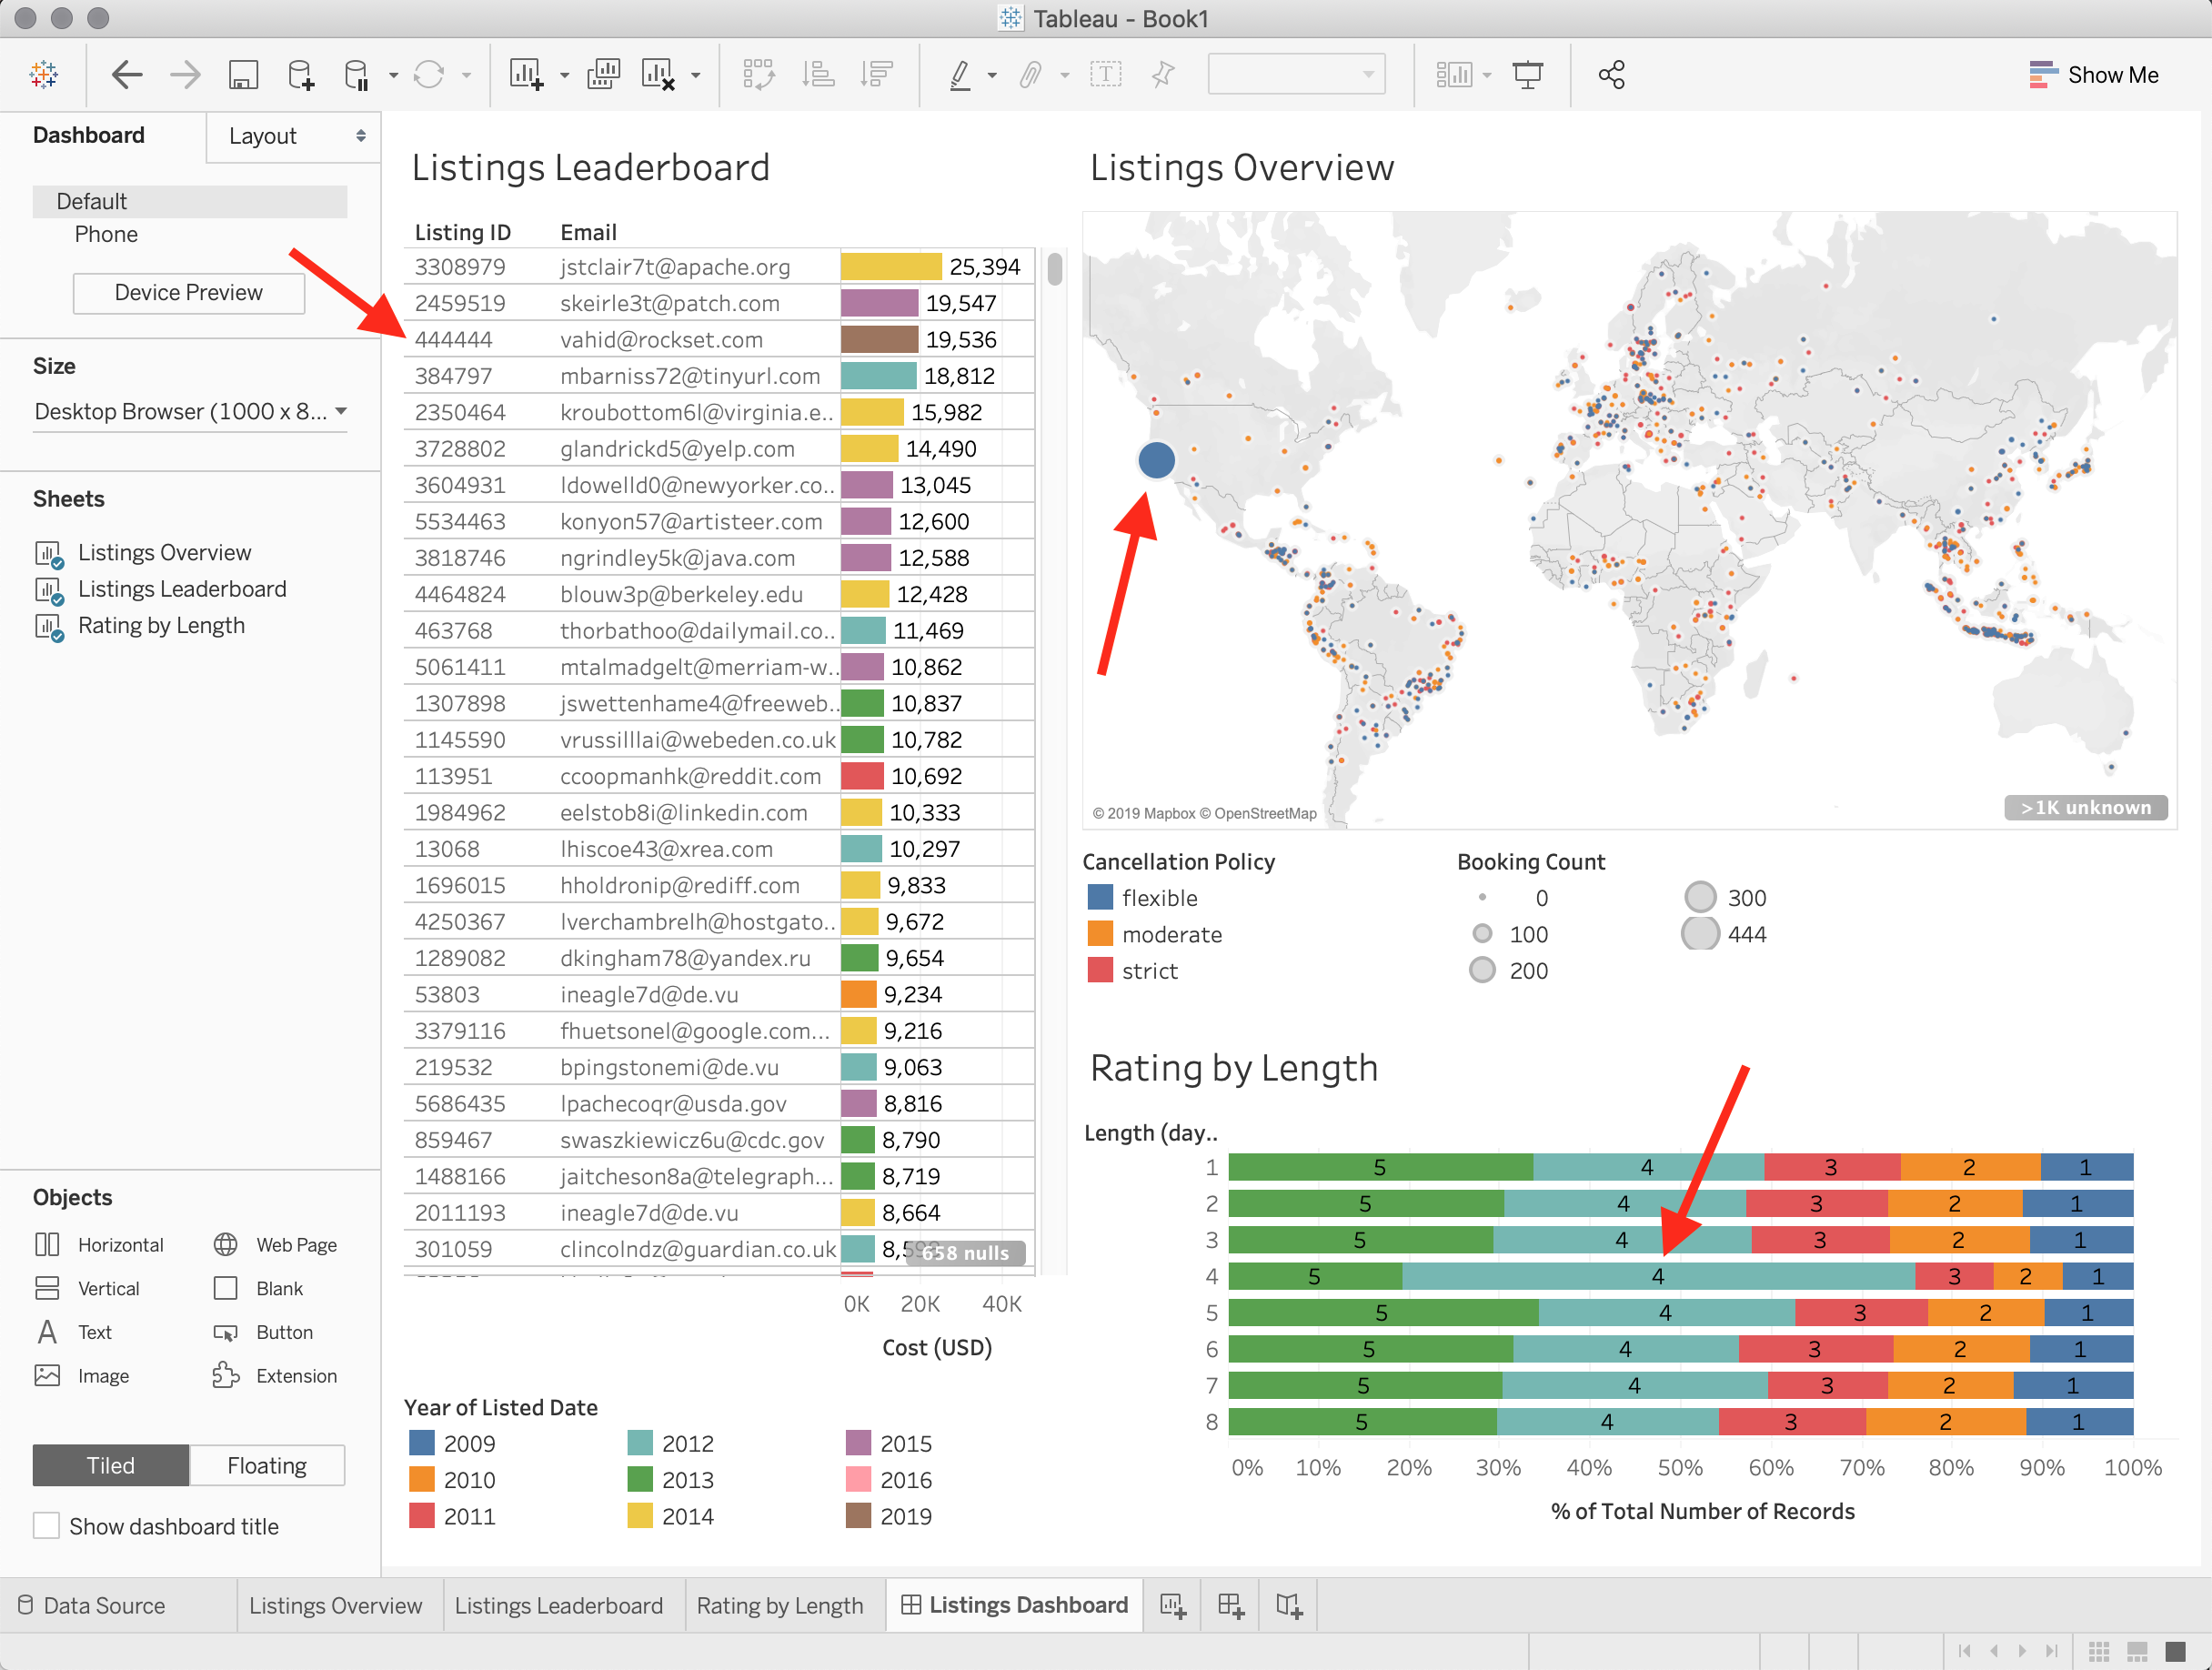
To illustrate that this dashboard gets updated in real time on the live DynamoDB source, we’ll add one record to try and noticeably skew some of the charts.
Let’s say I decide to sign up for this platform and list my own bedroom in San Francisco, listed for $44 a night. Then, I book my own room 444 times and give it a rating of 4 each time. This Python code snippet generates that record and adds it to DynamoDB:
import boto3

booking = {
        "user": {
            "first_name": "Vahid",
            "last_name": "Fazel-Rezai",
            "email": "vahid@rockset.com",
            "user_id": "fc8ca81a-d1fa-4156-b983-dc2b07c1443c"
        },
        "start_date": "2019-04-04",
        "length_days": "4",
        "review": {
            "rating": "4",
            "text": "Worked 4 me!"
        },
        "cost_usd": "44.00"
    }
item = {
        "first_name": "Vahid",
        "last_name": "Fazel-Rezai",
        "email": "vahid@rockset.com",
        "user_id": "fc8ca81a-d1fa-4156-b983-dc2b07c1443c",
        "listings": [{
            "listing_id": "444444",
            "title": "Bedroom for rent",
            "description": "A place to stay, simple but sufficient.",
            "city": "San Francisco",
            "country": "United States",
            "listed_date": "2019-04-04",
            "price_usd": "11.00",
            "cancellation_policy": "flexible",
            "bathrooms": "1",
            "bedrooms": "1",
            "beds": "1",
            "bookings": 444 * [booking]
        }]
    }

dynamodb = boto3.resource("dynamodb")
table = dynamodb.Table("rental_data")
table.put_item(Item = item)
Sure enough, we just have to refresh our dashboard in Tableau and we can see the difference immediately!
Summary
In this blog post, we walked through creating an interactive dashboard in Tableau that monitors core business data stored in DynamoDB. We used Rockset as the SQL intelligence layer between DynamoDB and Tableau. The steps we followed were:
- Start with data in a DynamoDB table.
- Create a collection in Rockset, using the DynamoDB table as a source.
- Write one or more SQL queries that return the data needed in Tableau.
- Create a data source in Tableau using custom SQL.
- Use the Tableau interface to create charts and dashboards.
Other DynamoDB resources:


